Technical Analysis of MBOX 2024-05-10
Overview:
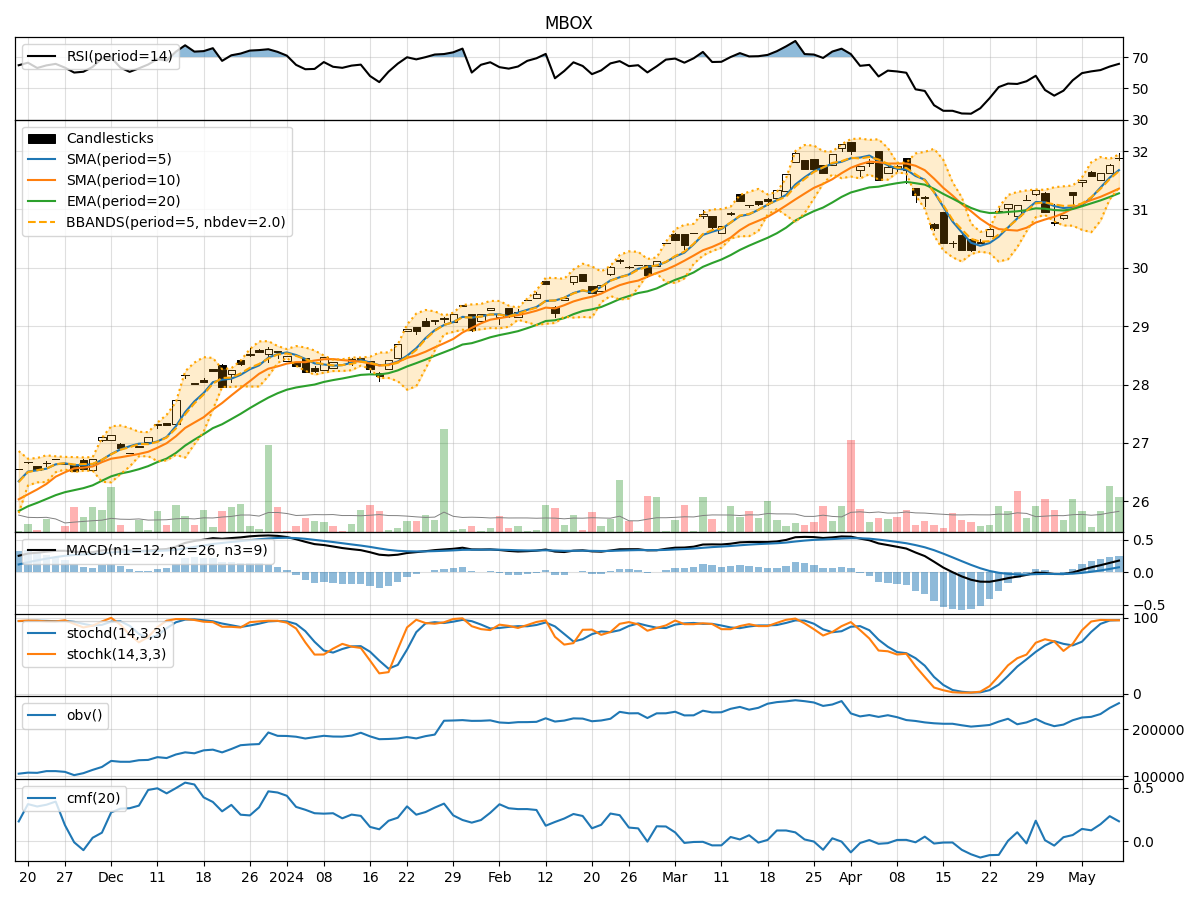
In analyzing the technical indicators for MBOX stock over the last 5 days, we will delve into the trend, momentum, volatility, and volume indicators to provide a comprehensive outlook on the possible stock price movement in the coming days.
Trend Analysis:
- Moving Averages (MA): The 5-day Moving Average (MA) has been consistently above the Simple Moving Average (SMA) and Exponential Moving Average (EMA), indicating a bullish trend.
- MACD: The MACD line has been consistently above the signal line, with both lines showing an upward trajectory, suggesting a bullish momentum.
- RSI: The Relative Strength Index (RSI) has been increasing and is currently in the overbought territory, indicating a strong bullish momentum.
Momentum Analysis:
- Stochastic Oscillator: Both %K and %D lines of the Stochastic Oscillator are in the overbought zone, suggesting a potential reversal or consolidation.
- Williams %R: The Williams %R is in the oversold territory, indicating a potential buying opportunity.
Volatility Analysis:
- Bollinger Bands (BB): The stock price has been trading within the upper Bollinger Band, indicating an overbought condition.
- BB% (Bollinger Band %B): The BB% is above 0.8, suggesting a high volatility period.
Volume Analysis:
- On-Balance Volume (OBV): The OBV has been increasing, indicating strong buying pressure.
- Chaikin Money Flow (CMF): The CMF is positive, suggesting that money is flowing into the stock.
Key Observations:
- The trend indicators suggest a strong bullish sentiment in the stock.
- Momentum indicators show signs of potential overbought conditions, indicating a possible reversal or consolidation.
- Volatility indicators point towards high volatility in the stock price.
- Volume indicators indicate strong buying pressure and positive money flow into the stock.
Conclusion:
Based on the analysis of the technical indicators, the next few days' possible stock price movement for MBOX is likely to be upward in the short term due to the strong bullish trend and positive volume indicators. However, caution is advised as momentum indicators signal potential overbought conditions, which could lead to a reversal or consolidation in the near future. Traders should closely monitor the price action and key support/resistance levels to make informed trading decisions.