Technical Analysis of MBS 2024-05-10
Overview:
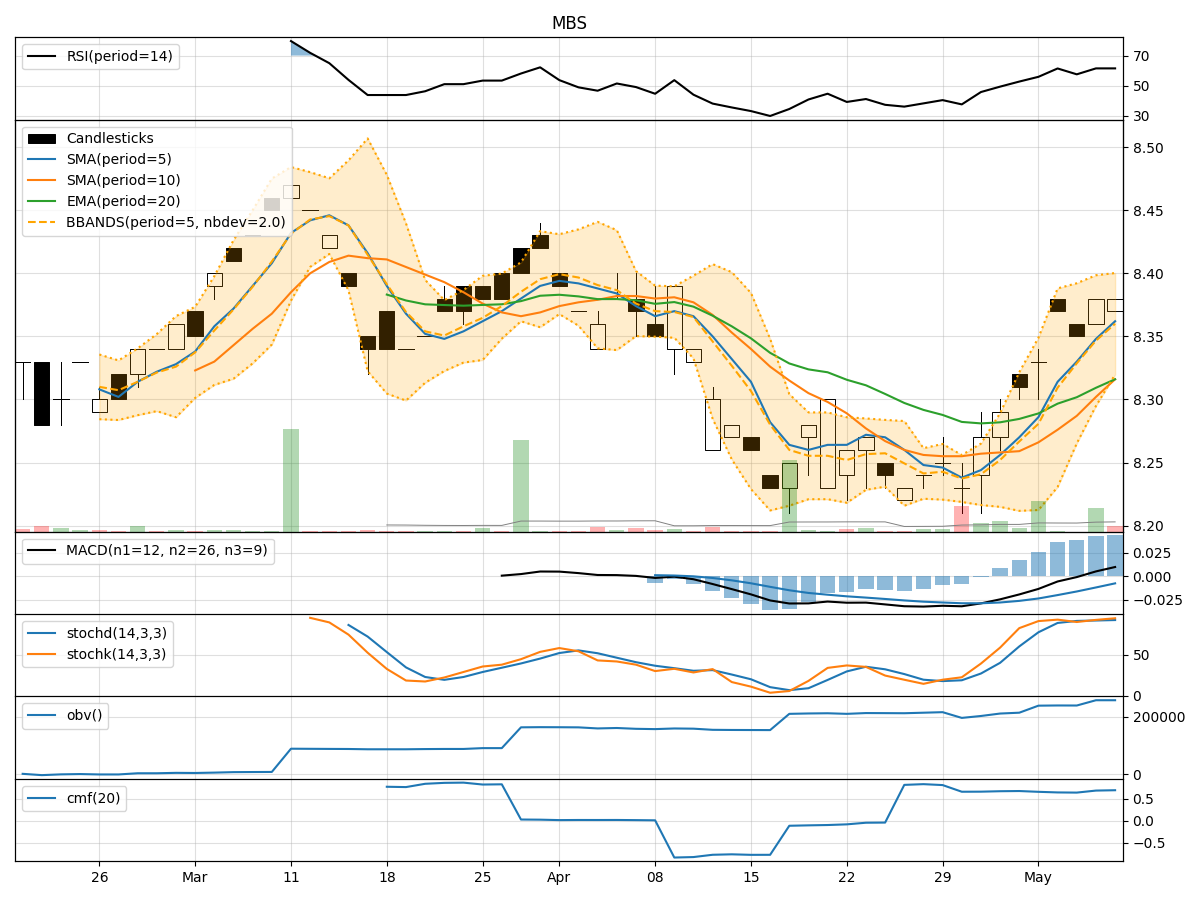
In the last 5 trading days, MBS stock has shown mixed signals across various technical indicators. The trend indicators suggest a slight uptrend, with moving averages and MACD showing positive momentum. Momentum indicators like RSI and Stochastic oscillators indicate a neutral to slightly bullish sentiment. Volatility indicators show a narrowing of Bollinger Bands, indicating potential consolidation. Volume indicators suggest a steady accumulation of volume.
Trend Indicators:
- Moving averages (MA) have been trending slightly upwards, indicating a positive trend.
- MACD (Moving Average Convergence Divergence) has been positive, showing bullish momentum.
- EMA (Exponential Moving Average) has been gradually increasing, supporting the uptrend.
Momentum Indicators:
- RSI (Relative Strength Index) has been hovering around the neutral zone, suggesting a balanced market sentiment.
- Stochastic oscillators show overbought conditions but have not yet signaled a reversal.
- Williams %R (Willams Percentage Range) is close to oversold levels, indicating a potential buying opportunity.
Volatility Indicators:
- Bollinger Bands have been narrowing, indicating decreasing volatility and a possible period of consolidation.
- The narrowing of the bands suggests a potential breakout in the near future, but the direction is uncertain.
Volume Indicators:
- On-Balance Volume (OBV) has been steadily increasing, indicating accumulation by investors.
- Chaikin Money Flow (CMF) has been positive, showing that money is flowing into the stock.
Conclusion:
Based on the analysis of the technical indicators, the next few days for MBS stock are likely to see sideways movement with a slight bullish bias. The trend indicators suggest a continuation of the uptrend, supported by positive momentum indicators. However, the narrowing Bollinger Bands indicate a potential consolidation phase before a possible breakout. The volume indicators support the current trend, showing accumulation by investors.
Key Conclusion: The stock is likely to consolidate in the short term before potentially resuming its uptrend. Investors may consider holding their positions or looking for buying opportunities during consolidation for potential gains in the future.