Technical Analysis of MBSF 2024-05-10
Overview:
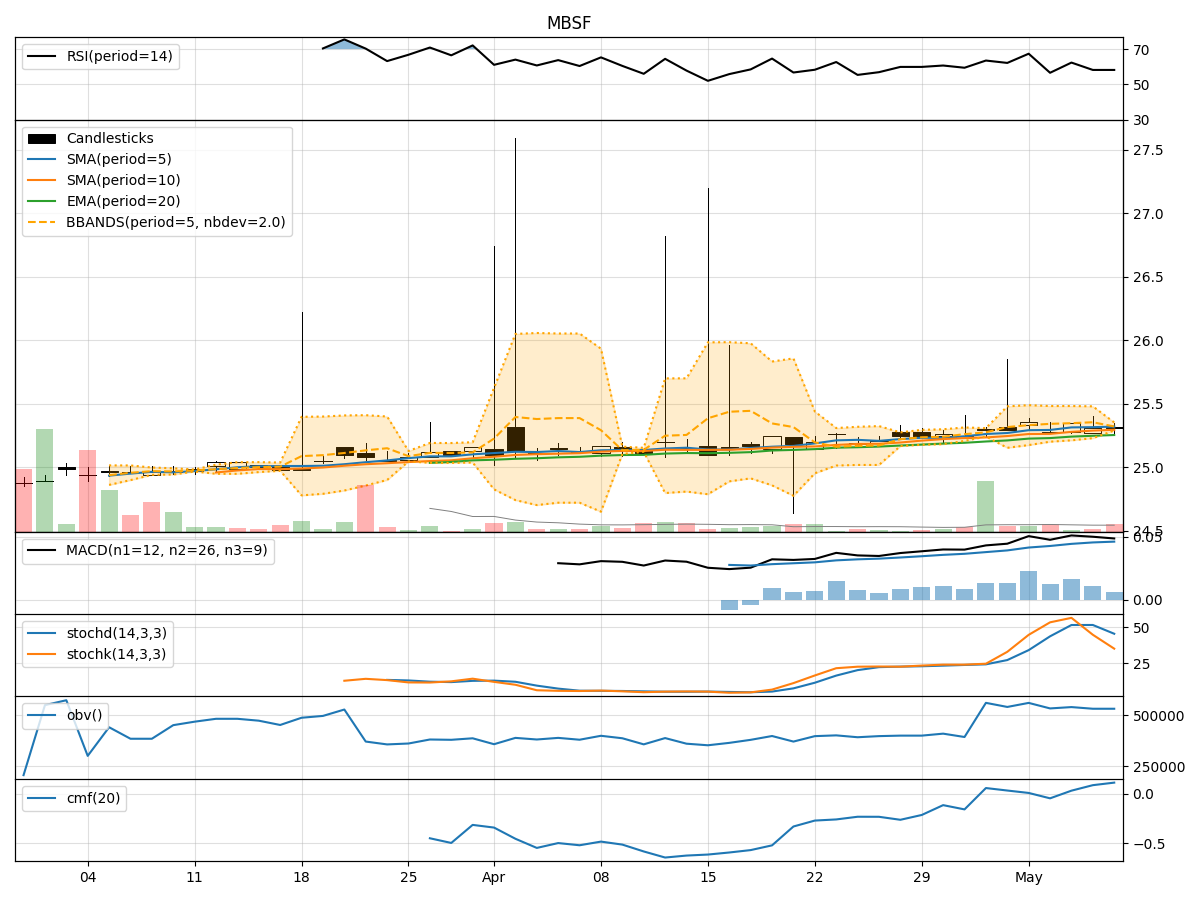
In analyzing the technical indicators for MBSF over the last 5 days, we will delve into the trend, momentum, volatility, and volume indicators to provide a comprehensive outlook on the possible stock price movement in the coming days. By examining these key indicators, we aim to offer valuable insights and predictions for informed decision-making.
Trend Analysis:
- Moving Averages (MA): The 5-day MA has been consistently above the closing prices, indicating a short-term uptrend.
- MACD: The MACD line has been positive, with the MACD histogram showing a slight increase, suggesting bullish momentum.
- EMA: The EMA has been trending upwards, supporting the bullish sentiment in the short to medium term.
Momentum Analysis:
- RSI: The RSI has been fluctuating around the mid-level, indicating a balanced momentum without extreme overbought or oversold conditions.
- Stochastic Oscillator: Both %K and %D have been fluctuating, showing indecision in momentum direction.
- Williams %R: The indicator has been in oversold territory, suggesting a potential reversal in momentum.
Volatility Analysis:
- Bollinger Bands (BB): The bands have been relatively narrow, indicating low volatility and a potential breakout in price.
- Bollinger %B: The %B indicator has been hovering around the middle, reflecting a neutral stance in volatility.
- Bollinger Band Width: The band width has been contracting, signaling a potential increase in volatility soon.
Volume Analysis:
- On-Balance Volume (OBV): The OBV has been relatively flat, suggesting a balance between buying and selling pressure.
- Chaikin Money Flow (CMF): The CMF has shown a slight increase, indicating a potential inflow of money into the stock.
Conclusion:
Based on the analysis of the technical indicators, the stock of MBSF is likely to experience sideways consolidation in the coming days. The trend indicators suggest a bullish bias in the short term, supported by positive MACD and EMA trends. However, the momentum indicators show indecisiveness in the market sentiment, with RSI hovering around the neutral zone and stochastic oscillating. Volatility is expected to increase based on the contraction of Bollinger Bands, potentially leading to a breakout. The volume indicators indicate a balanced market with no clear dominance of buying or selling pressure.
Recommendation:
Considering the overall analysis, it is advisable to monitor the stock closely for any signs of a breakout from the consolidation phase. Traders may consider setting tight stop-loss levels to manage risk effectively. Investors could wait for more clarity in market direction before making significant moves. Keep a close eye on key support and resistance levels for potential entry or exit points.
In conclusion, while the short-term trend appears bullish, the lack of clear momentum direction and increasing volatility suggest a period of consolidation for MBSF. Stay vigilant and adapt your strategy accordingly to navigate potential price movements effectively.