Technical Analysis of MCHS 2024-05-10
Overview:
In analyzing the technical indicators for MCHS stock over the last 5 days, we will delve into the trend, momentum, volatility, and volume indicators to provide a comprehensive outlook on the possible future stock price movement. By examining these key aspects, we aim to offer valuable insights and recommendations for potential investors.
Trend Analysis:
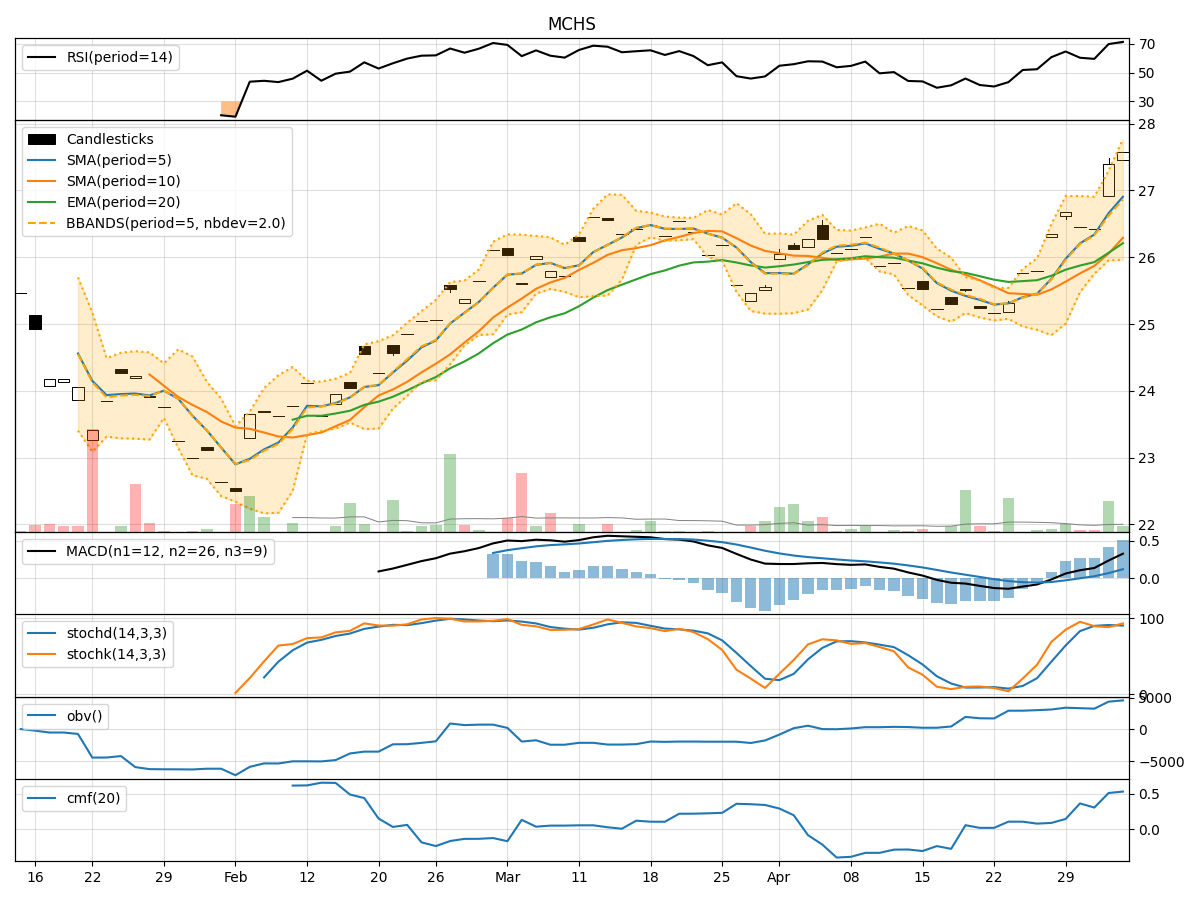
- Moving Averages (MA): The 5-day Moving Average (MA) has been consistently above the Simple Moving Average (SMA) and Exponential Moving Average (EMA), indicating a bullish trend.
- MACD: The MACD line has been above the signal line, suggesting positive momentum in the stock price.
- Conclusion: The trend indicators point towards an upward trend in the stock price.
Momentum Analysis:
- RSI: The Relative Strength Index (RSI) has been fluctuating but generally staying above 50, indicating bullish momentum.
- Stochastic Oscillator: Both %K and %D have been relatively high, suggesting strong buying pressure.
- Conclusion: Momentum indicators signal a bullish sentiment in the stock.
Volatility Analysis:
- Bollinger Bands (BB): The stock price has been trading within the Bollinger Bands, with the bands narrowing, indicating decreasing volatility.
- Conclusion: Volatility indicators suggest a consolidation phase in the stock price.
Volume Analysis:
- On-Balance Volume (OBV): The OBV has been relatively stable, indicating consistent buying volume.
- Chaikin Money Flow (CMF): The CMF has been positive, reflecting buying pressure.
- Conclusion: Volume indicators support the bullish sentiment in the stock.
Overall Conclusion:
Based on the analysis of trend, momentum, volatility, and volume indicators, the overall outlook for MCHS stock is bullish. The stock is likely to experience an upward movement in the next few days. Investors may consider entering long positions or holding onto existing positions to capitalize on the expected price appreciation.
Key Points:
- Trend: Upward trend supported by moving averages and MACD.
- Momentum: Bullish momentum indicated by RSI and Stochastic Oscillator.
- Volatility: Consolidation phase with decreasing volatility.
- Volume: Stable buying volume with positive CMF.
Recommendation:
Considering the bullish signals across all technical indicators, it is advisable for investors to consider buying or holding MCHS stock for potential gains in the upcoming trading sessions. However, it is essential to monitor the indicators regularly for any signs of reversal or change in trend.