Technical Analysis of MCSE 2024-05-10
Overview:
In analyzing the technical indicators for MCSE stock over the last 5 days, we will delve into the trend, momentum, volatility, and volume indicators to provide a comprehensive outlook on the possible stock price movement in the coming days. By examining key metrics such as moving averages, MACD, RSI, Bollinger Bands, and OBV, we aim to offer valuable insights and predictions for potential price action.
Trend Indicators:
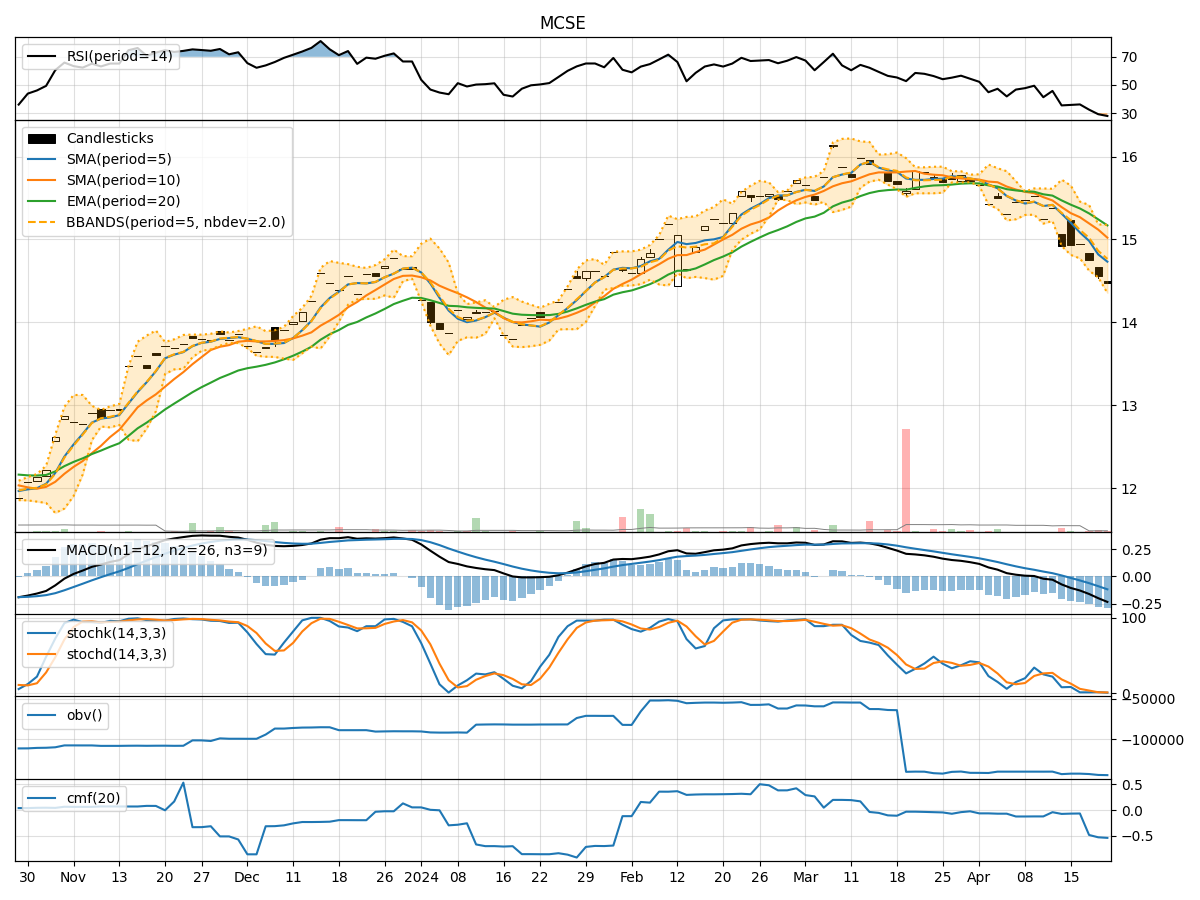
- Moving Averages (MA): The 5-day MA has been trending upwards, indicating a positive short-term momentum.
- MACD: The MACD line has been consistently below the signal line, suggesting a bearish trend.
- MACD Histogram: The histogram has been increasing, indicating a potential reversal in the bearish trend.
Momentum Indicators:
- RSI: The RSI has been fluctuating around the neutral zone, indicating indecision in the market.
- Stochastic Oscillator: Both %K and %D have been in overbought territory, signaling a potential reversal.
- Williams %R: The indicator has been hovering around oversold levels, suggesting a possible buying opportunity.
Volatility Indicators:
- Bollinger Bands: The stock price has been trading within the bands, indicating a period of consolidation.
- Bollinger %B: The %B value has been fluctuating, reflecting the sideways movement in the stock price.
Volume Indicators:
- On-Balance Volume (OBV): The OBV has been relatively stable, indicating a balance between buying and selling pressure.
- Chaikin Money Flow (CMF): The CMF has been negative, suggesting a lack of buying interest in the stock.
Key Observations and Opinions:
- Trend: The short-term trend is bullish based on the moving averages, but the MACD signals a bearish sentiment. There might be a potential reversal in the bearish trend as indicated by the MACD histogram.
- Momentum: The momentum indicators show conflicting signals, with the RSI and Williams %R indicating indecision while the Stochastic Oscillator suggests a possible reversal.
- Volatility: The Bollinger Bands indicate a period of consolidation, with the %B value reflecting sideways movement in the stock price.
- Volume: The volume indicators show a lack of significant buying interest, as seen in the negative CMF and stable OBV.
Conclusion:
Based on the analysis of the technical indicators, the stock price of MCSE is likely to experience sideways movement in the coming days. The conflicting signals from the trend, momentum, and volume indicators suggest a lack of clear direction in the market. Traders should exercise caution and wait for more definitive signals before making any significant trading decisions.