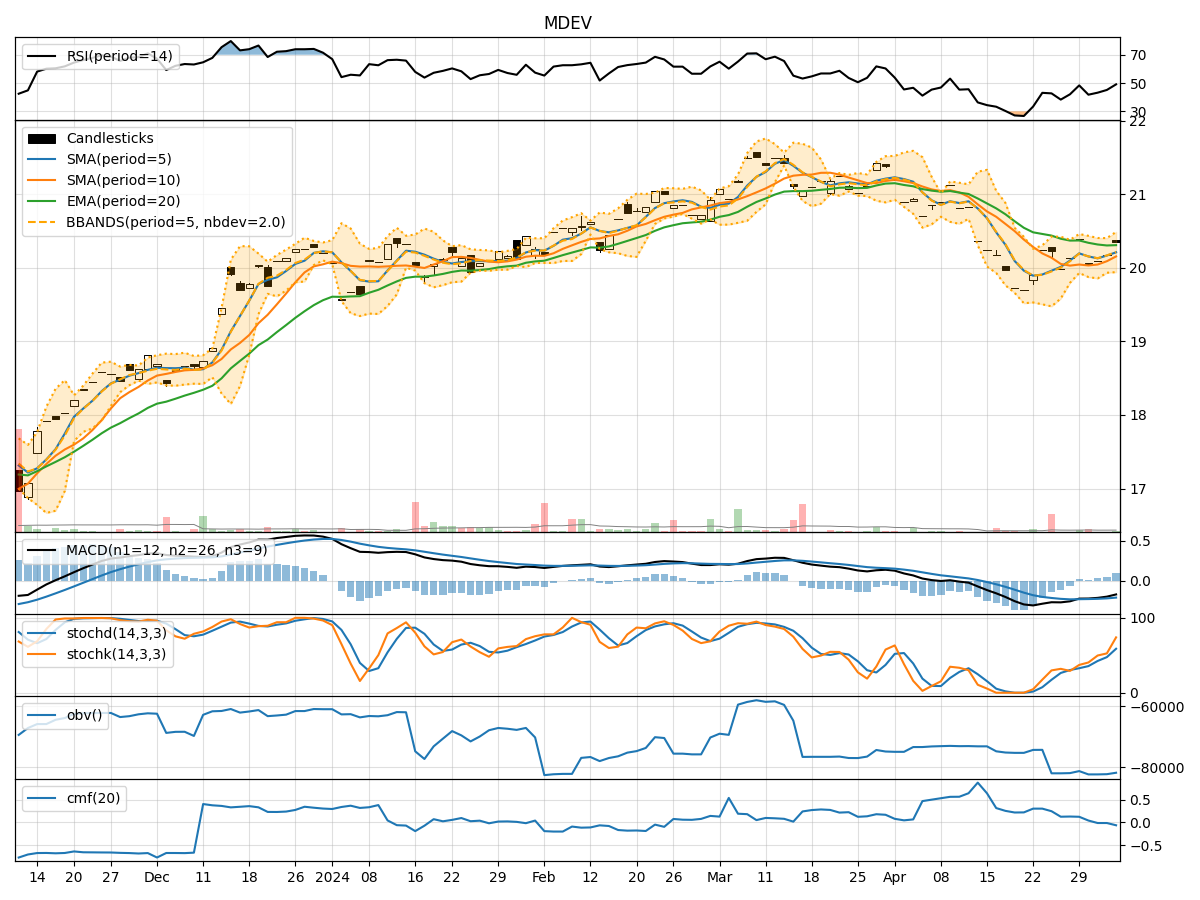
Technical Analysis of MDEV 2024-05-10
Overview:
In the last 5 trading days, MDEV stock has shown mixed signals across various technical indicators. The trend indicators suggest a slightly bearish sentiment, with the Moving Average Convergence Divergence (MACD) showing negative values. Momentum indicators are relatively neutral, with the Relative Strength Index (RSI) hovering around the mid-level. Volatility indicators indicate a narrowing of the Bollinger Bands, potentially signaling a decrease in price volatility. Volume indicators show a consistent On-Balance Volume (OBV) but a slightly declining Chaikin Money Flow (CMF).
Trend Indicators:
- Moving Averages (MA) are slightly above the closing prices, indicating a potential downward pressure.
- MACD is negative, suggesting a bearish momentum.
- Exponential Moving Average (EMA) is relatively flat, indicating a lack of strong trend direction.
Momentum Indicators:
- RSI is around 50, indicating a neutral sentiment.
- Stochastic Oscillator shows mixed signals, with %K and %D values fluctuating.
- Williams %R is close to 0, suggesting a potential oversold condition.
Volatility Indicators:
- Bollinger Bands are narrowing, indicating decreasing price volatility.
- Bollinger Band Percentage (BBP) is decreasing, suggesting a potential consolidation phase.
Volume Indicators:
- On-Balance Volume (OBV) has been relatively stable, indicating consistent buying pressure.
- Chaikin Money Flow (CMF) is slightly declining, suggesting a decrease in buying momentum.
Conclusion:
Based on the analysis of the technical indicators, the next few days for MDEV stock are likely to see sideways movement with a slight bearish bias. The narrowing Bollinger Bands and decreasing volatility indicate a potential consolidation phase. The mixed signals from momentum indicators and the slightly declining CMF suggest a lack of strong buying momentum. Traders should exercise caution and closely monitor price action for any potential breakout or reversal signals.
Recommendation:
- Consider setting tight stop-loss levels to manage risk during the consolidation phase.
- Monitor key support and resistance levels for potential breakout opportunities.
- Keep a close eye on any significant changes in volume and momentum indicators for early trend reversal signals.
Remember, market conditions can change rapidly, so it's essential to stay updated with real-time data and adjust your trading strategy accordingly.