Technical Analysis of MDPL 2024-05-10
Overview:
In analyzing the technical indicators for MDPL stock over the last 5 days, we will delve into the trend, momentum, volatility, and volume indicators to provide a comprehensive outlook on the possible stock price movement in the coming days. By examining these key indicators, we aim to offer valuable insights and predictions for potential investors.
Trend Indicators:
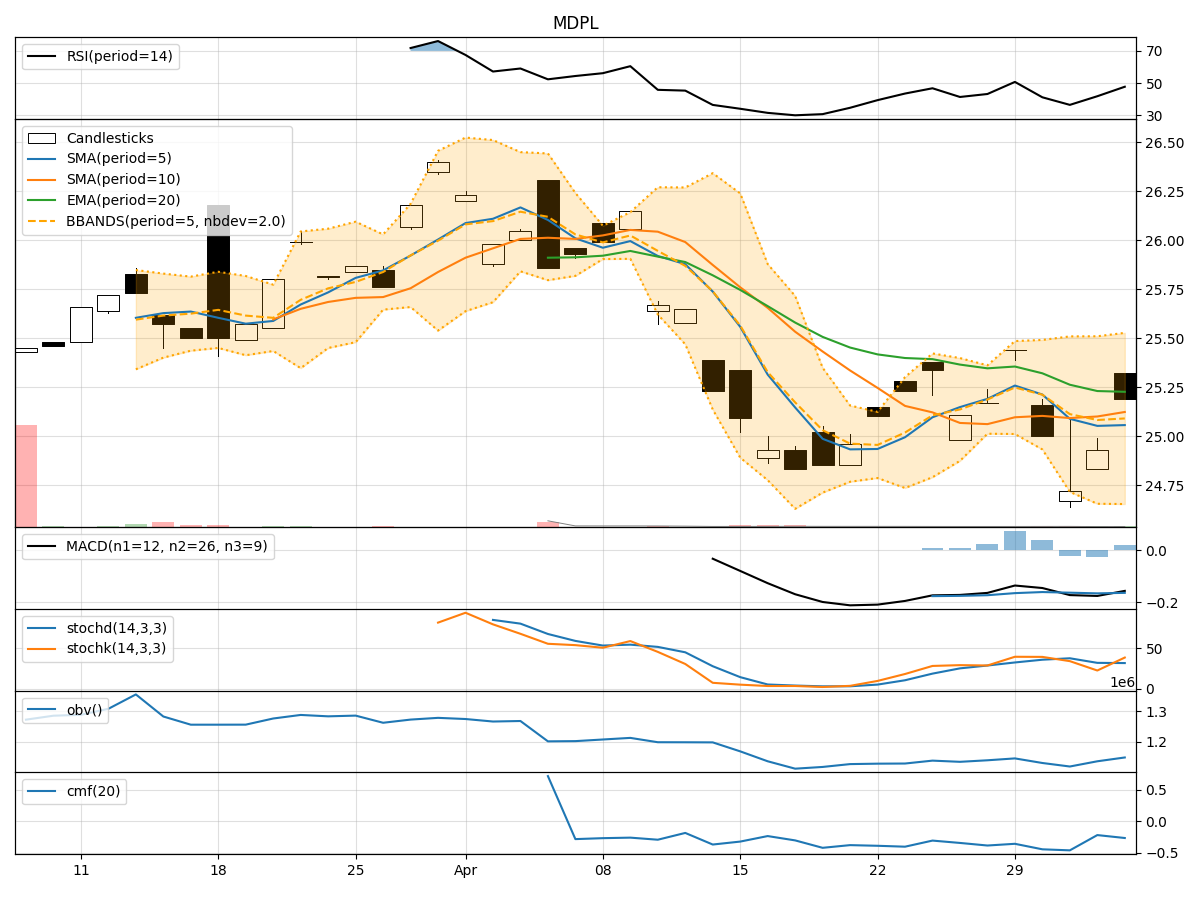
- Moving Averages (MA): The 5-day moving average has been consistently above the simple moving average (SMA) and exponential moving average (EMA), indicating a short-term uptrend.
- MACD: The MACD line has been below the signal line, suggesting a bearish momentum in the stock price.
- MACD Histogram: The MACD histogram has been decreasing, indicating a weakening bearish momentum.
Momentum Indicators:
- RSI: The Relative Strength Index (RSI) has been hovering around the mid-level, indicating a neutral momentum in the stock.
- Stochastic Oscillator: Both %K and %D lines of the stochastic oscillator have been in the overbought zone, suggesting a potential reversal in the stock price.
- Williams %R: The Williams %R indicator has been indicating oversold conditions, potentially signaling a bullish reversal.
Volatility Indicators:
- Bollinger Bands: The stock price has been trading within the Bollinger Bands, with the bands narrowing, indicating decreasing volatility.
- Bollinger %B: The %B indicator has been fluctuating around the mid-level, suggesting a neutral stance in terms of volatility.
Volume Indicators:
- On-Balance Volume (OBV): The OBV indicator has been relatively flat, indicating a balance between buying and selling pressure.
- Chaikin Money Flow (CMF): The CMF has been negative, suggesting a bearish money flow in the stock.
Key Observations and Opinions:
- Trend: The stock is in a short-term uptrend based on moving averages, but the MACD signals a bearish momentum.
- Momentum: The momentum indicators are mixed, with the stochastic oscillator and Williams %R suggesting a potential bullish reversal.
- Volatility: Volatility has been decreasing, indicating a possible period of consolidation.
- Volume: The volume indicators show a lack of strong buying or selling pressure.
Conclusion:
Based on the analysis of the technical indicators, the next few days for MDPL stock could see sideways movement with a potential bullish bias. Investors should closely monitor the stochastic oscillator and Williams %R for confirmation of a bullish reversal. Additionally, keeping an eye on the MACD for any signs of a shift in momentum is crucial. Overall, a cautious approach with a bullish inclination is recommended for potential investors in the coming days.