Technical Analysis of MEDX 2024-05-10
Overview:
In analyzing the technical indicators for MEDX over the last 5 days, we will delve into the trend, momentum, volatility, and volume indicators to provide a comprehensive assessment of the stock's potential price movement. By examining these key factors, we aim to offer valuable insights and predictions for the next few days.
Trend Analysis:
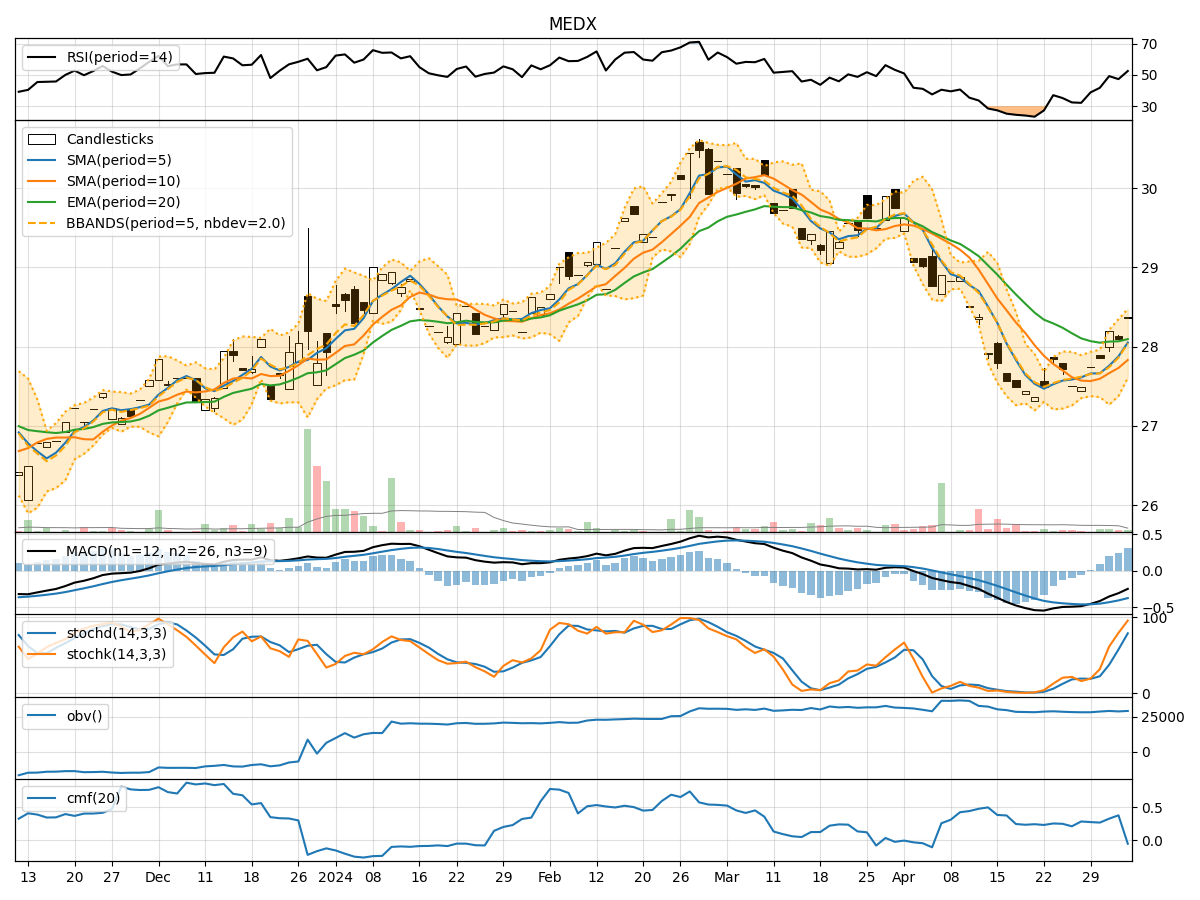
- Moving Averages (MA): The 5-day Moving Average (MA) has been consistently above the Simple Moving Average (SMA) and Exponential Moving Average (EMA), indicating a short-term bullish trend.
- MACD: The MACD line has been below the signal line, suggesting a bearish trend. However, the MACD Histogram has shown signs of convergence, hinting at a potential trend reversal.
Momentum Analysis:
- RSI: The Relative Strength Index (RSI) has been fluctuating around the neutral level of 50, indicating a lack of strong momentum in either direction.
- Stochastic Oscillator: The Stochastic Oscillator has been in the overbought territory, suggesting a potential reversal or consolidation in the near term.
Volatility Analysis:
- Bollinger Bands (BB): The Bollinger Bands have been narrowing, indicating decreasing volatility and a possible period of consolidation.
- Bollinger %B (BBP): The %B indicator has been hovering around the middle range, reflecting a balanced market sentiment.
Volume Analysis:
- On-Balance Volume (OBV): The OBV has shown a slight increase, suggesting some accumulation by investors.
- Chaikin Money Flow (CMF): The CMF has been negative, indicating a net outflow of money from the stock.
Conclusion:
Based on the analysis of the technical indicators, the stock of MEDX is likely to experience sideways movement in the next few days. The trend indicators suggest a mixed outlook with a potential for a trend reversal, while momentum indicators point to a lack of strong buying or selling pressure. Volatility is decreasing, indicating a period of consolidation, and volume indicators show a neutral to slightly negative sentiment.
In conclusion, the overall technical outlook for MEDX suggests a sideways consolidation pattern in the near term, with limited directional bias. Traders may consider adopting a range-bound strategy until clearer signals emerge from the technical indicators.