Technical Analysis of MEMS 2024-05-10
Overview:
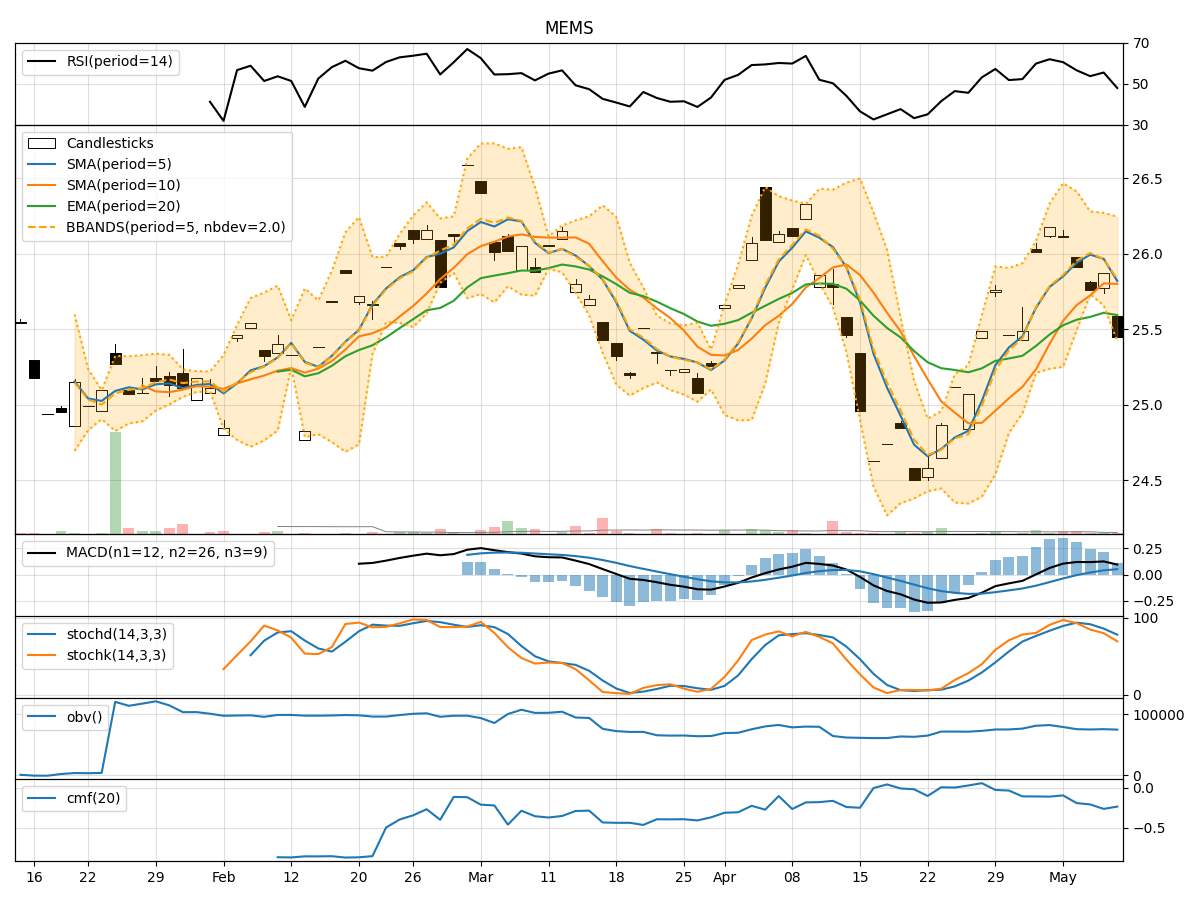
In the last 5 trading days, MEMS stock has shown mixed signals across various technical indicators. The trend indicators suggest a slightly bullish sentiment, with the moving averages trending upwards. Momentum indicators indicate a neutral to slightly bearish sentiment, with RSI showing a slight decline. Volatility indicators suggest a decrease in volatility, while volume indicators show a slight decrease in buying pressure.
Trend Indicators:
- Moving Averages (MA): The 5-day MA is above the 10-day SMA, indicating a short-term bullish trend. The EMA(20) is also trending upwards, supporting a bullish view.
- MACD: The MACD line is above the signal line, indicating a bullish momentum.
- MACD Histogram: The MACD histogram is positive, suggesting bullish momentum.
Key Observation: The trend indicators overall suggest a bullish sentiment in the short term.
Momentum Indicators:
- RSI (14): The RSI has been declining but is still above 50, indicating a neutral to slightly bearish sentiment.
- Stochastic Oscillator: Both %K and %D are declining, suggesting a weakening momentum.
- Williams %R: The Williams %R is in oversold territory, indicating a possible reversal.
Key Observation: Momentum indicators show a neutral to slightly bearish sentiment, with potential for a reversal.
Volatility Indicators:
- Bollinger Bands (BB): The bands are narrowing, indicating decreasing volatility.
- Bollinger %B: The %B is close to 0.5, suggesting a balanced market sentiment.
Key Observation: Volatility indicators point towards decreasing volatility and a balanced market sentiment.
Volume Indicators:
- On-Balance Volume (OBV): The OBV has been declining, indicating a decrease in buying pressure.
- Chaikin Money Flow (CMF): The CMF is negative, suggesting a bearish money flow.
Key Observation: Volume indicators show a decrease in buying pressure and a bearish money flow.
Conclusion:
Based on the analysis of the technical indicators, the next few days' possible stock price movement for MEMS is likely to be sideways with a slight bearish bias. While trend indicators suggest a bullish sentiment in the short term, momentum indicators indicate a neutral to slightly bearish outlook. Volatility indicators point towards decreasing volatility, and volume indicators show a decrease in buying pressure and a bearish money flow.
Overall, the stock is likely to consolidate in the near term with a potential for a slight downward movement. Traders should exercise caution and consider waiting for clearer signals before making significant trading decisions.