Technical Analysis of MEMX 2024-05-10
Overview:
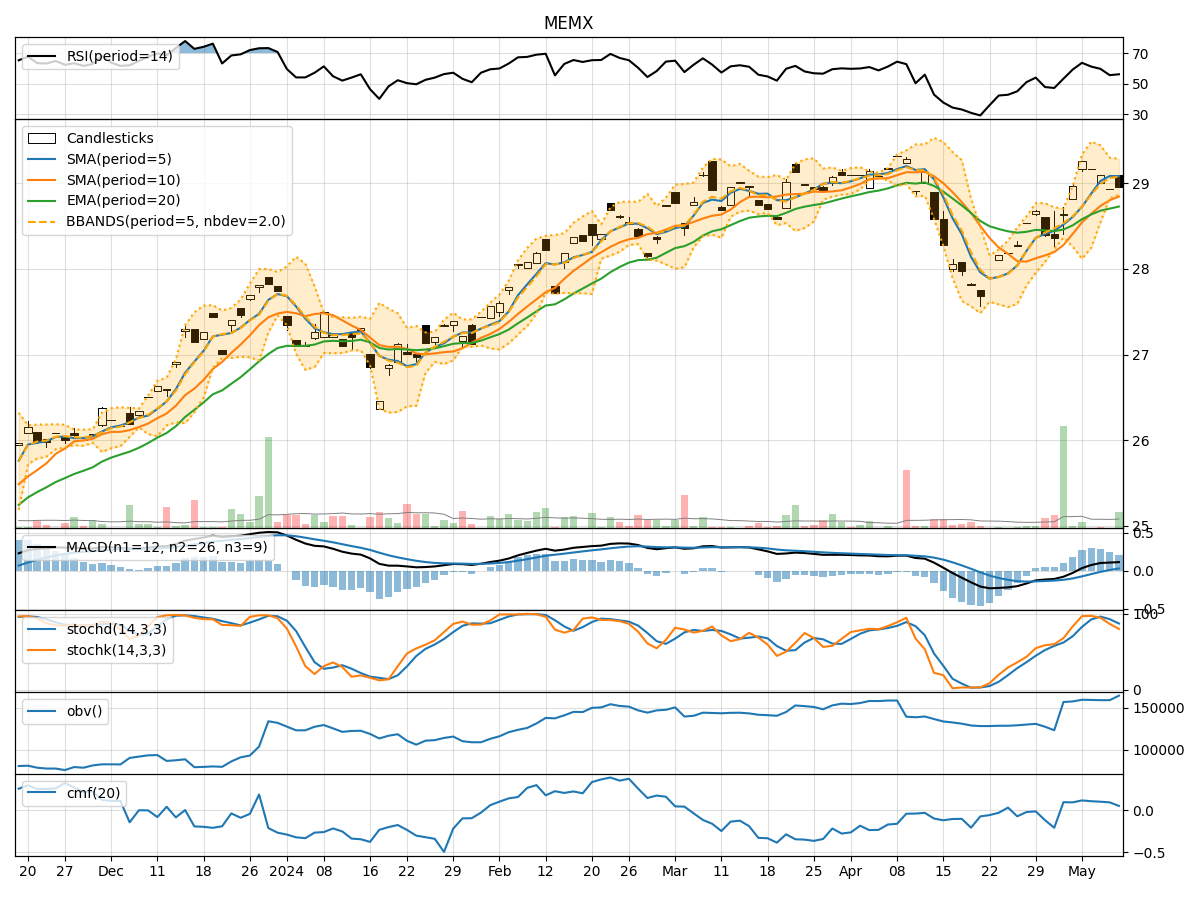
In the last 5 trading days, MEMX stock has shown a mixed performance with fluctuations in price and volume. By analyzing the technical indicators on trend, momentum, volatility, and volume, we can gain insights into the possible future price movement of MEMX stock.
Trend Analysis:
- Moving Averages (MA): The 5-day Moving Average (MA) has been consistently above the Simple Moving Average (SMA) and Exponential Moving Average (EMA), indicating a short-term uptrend.
- MACD: The MACD line has been above the signal line, suggesting bullish momentum.
- Momentum: The Relative Strength Index (RSI) has been fluctuating but generally staying above 50, indicating potential strength in the uptrend.
Momentum Analysis:
- RSI: The RSI has been oscillating around the 50 level, indicating a balanced momentum between buying and selling pressure.
- Stochastic Oscillator: The Stochastic indicators have been gradually decreasing but are still in the overbought territory, suggesting a potential reversal.
Volatility Analysis:
- Bollinger Bands (BB): The Bollinger Bands have been narrowing, indicating decreasing volatility.
- Bollinger Band Percentage (BBP): The BBP has been fluctuating around the midpoint, suggesting a neutral stance in terms of volatility.
Volume Analysis:
- On-Balance Volume (OBV): The OBV has shown a slight increase, indicating accumulation of the stock.
- Chaikin Money Flow (CMF): The CMF has been positive but decreasing, suggesting a potential decrease in buying pressure.
Key Observations:
- The trend indicators suggest a short-term uptrend in MEMX stock.
- Momentum indicators show a balanced momentum with a potential for a reversal.
- Volatility has been decreasing, indicating a possible period of consolidation.
- Volume indicators point towards accumulation but with a slight decrease in buying pressure.
Conclusion:
Based on the analysis of technical indicators, MEMX stock is likely to experience sideways consolidation in the next few days. The mixed signals from momentum and volume indicators, along with decreasing volatility, suggest a period of indecision in the market. Traders may expect the stock to trade within a range without a clear directional bias. It is advisable to closely monitor key support and resistance levels for potential breakout or breakdown scenarios.