Technical Analysis of MFDX 2024-05-10
Overview:
In analyzing the technical indicators for MFDX over the last 5 days, we will delve into the trend, momentum, volatility, and volume indicators to provide a comprehensive outlook on the possible stock price movement in the coming days. By examining these key indicators, we aim to offer valuable insights and predictions to guide investment decisions.
Trend Indicators:
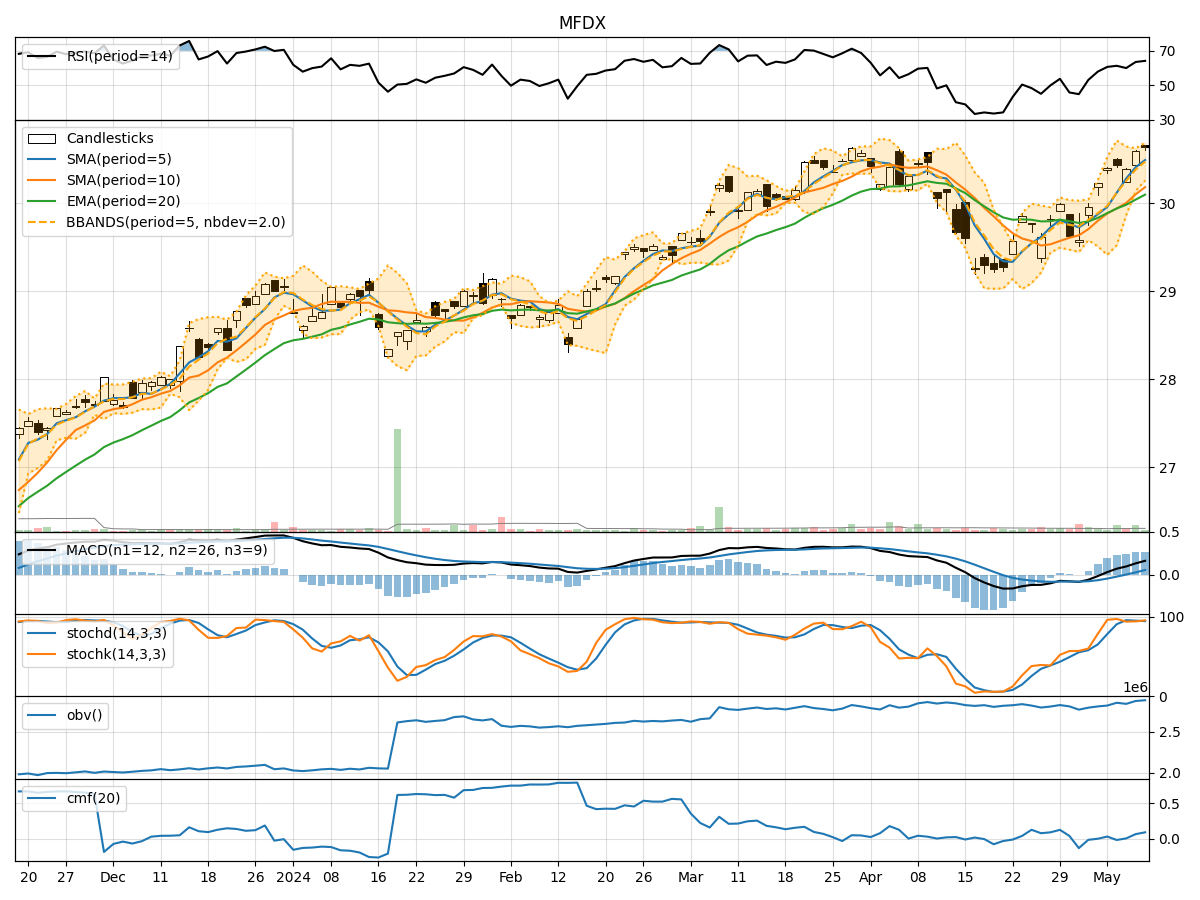
- Moving Averages (MA): The 5-day MA has been consistently above the 10-day SMA, indicating a short-term bullish trend.
- MACD: The MACD line has been trending upwards, with the MACD histogram showing positive values, suggesting bullish momentum.
- EMA: The EMA has been steadily increasing, supporting the bullish trend.
Momentum Indicators:
- RSI: The RSI has been in the overbought territory, indicating strong buying momentum.
- Stochastic Oscillator: Both %K and %D have been in the overbought zone, signaling a potential reversal.
- Williams %R: The indicator has been fluctuating around oversold levels, suggesting a mixed sentiment.
Volatility Indicators:
- Bollinger Bands: The price has been trading within the bands, indicating normal volatility.
- Bollinger %B: The %B indicator has been hovering around the middle, reflecting balanced volatility levels.
Volume Indicators:
- On-Balance Volume (OBV): The OBV has been trending upwards, indicating accumulation by investors.
- Chaikin Money Flow (CMF): The CMF has been positive, suggesting buying pressure in the market.
Key Observations:
- The trend indicators suggest a bullish sentiment in the short term.
- Momentum indicators show mixed signals with overbought conditions.
- Volatility remains stable with no extreme movements.
- Volume indicators indicate increasing buying interest in the stock.
Conclusion:
Based on the analysis of the technical indicators, the stock is likely to experience a continuation of the bullish trend in the next few days. However, caution is advised as some momentum indicators are showing signs of potential reversal. Traders should closely monitor the stochastic oscillator and Williams %R for any shifts in momentum. Overall, the stock is expected to maintain its upward trajectory with intermittent periods of consolidation.