Technical Analysis of MFEM 2024-05-10
Overview:
In analyzing the technical indicators for MFEM over the last 5 days, we will delve into the trend, momentum, volatility, and volume indicators to provide a comprehensive assessment of the stock's potential price movement. By examining these key factors, we aim to offer valuable insights and predictions for the next few days.
Trend Analysis:
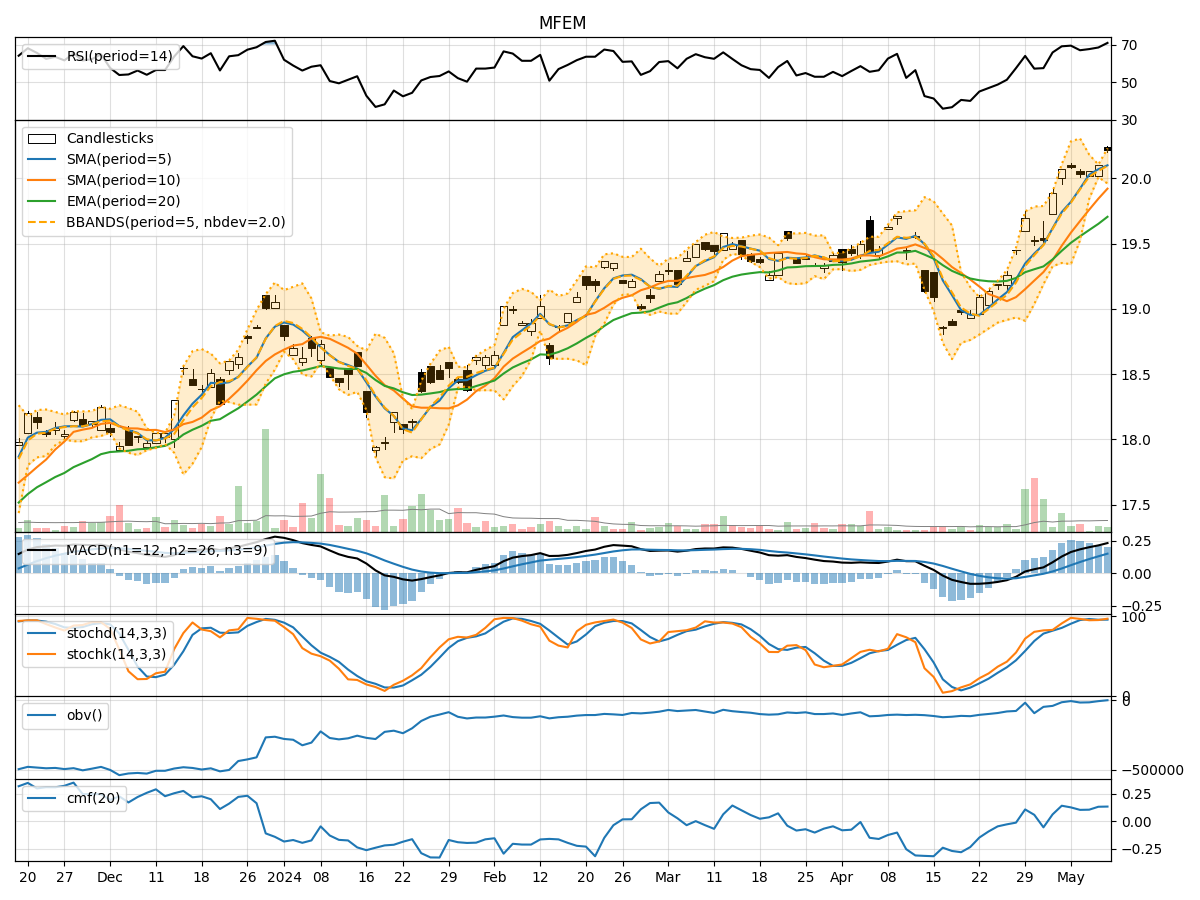
- Moving Averages (MA): The 5-day Moving Average (MA) has been consistently above the Simple Moving Average (SMA) and Exponential Moving Average (EMA), indicating a bullish trend.
- MACD: The MACD line has been consistently above the signal line, with both lines showing an upward trend, suggesting bullish momentum.
Momentum Analysis:
- RSI: The Relative Strength Index (RSI) has been in the overbought territory, indicating a strong bullish momentum.
- Stochastic Oscillator: Both %K and %D lines of the Stochastic Oscillator have been in the overbought zone, signaling a potential reversal or consolidation.
Volatility Analysis:
- Bollinger Bands (BB): The stock price has been trading within the upper Bollinger Band (BBU), suggesting an overbought condition.
Volume Analysis:
- On-Balance Volume (OBV): The OBV has been showing an overall positive trend, indicating accumulation by investors.
- Chaikin Money Flow (CMF): The CMF has been consistently positive, reflecting buying pressure in the stock.
Key Observations:
- The stock is currently in a strong bullish trend based on moving averages and MACD.
- Momentum indicators like RSI and Stochastic Oscillator suggest a potential overbought condition, signaling a need for caution.
- Volatility indicators show the stock is at the upper end of its price range, indicating a possible pullback or consolidation.
- Volume indicators reflect positive accumulation and buying pressure in the stock.
Conclusion:
Based on the technical analysis of MFEM, the stock is currently in an overbought condition with strong bullish momentum. However, the potential for a pullback or consolidation exists due to the overbought signals from momentum and volatility indicators. Traders should exercise caution and consider taking profits or implementing risk management strategies in anticipation of a possible correction in the stock price in the next few days.