Technical Analysis of MFLX 2024-05-10
Overview:
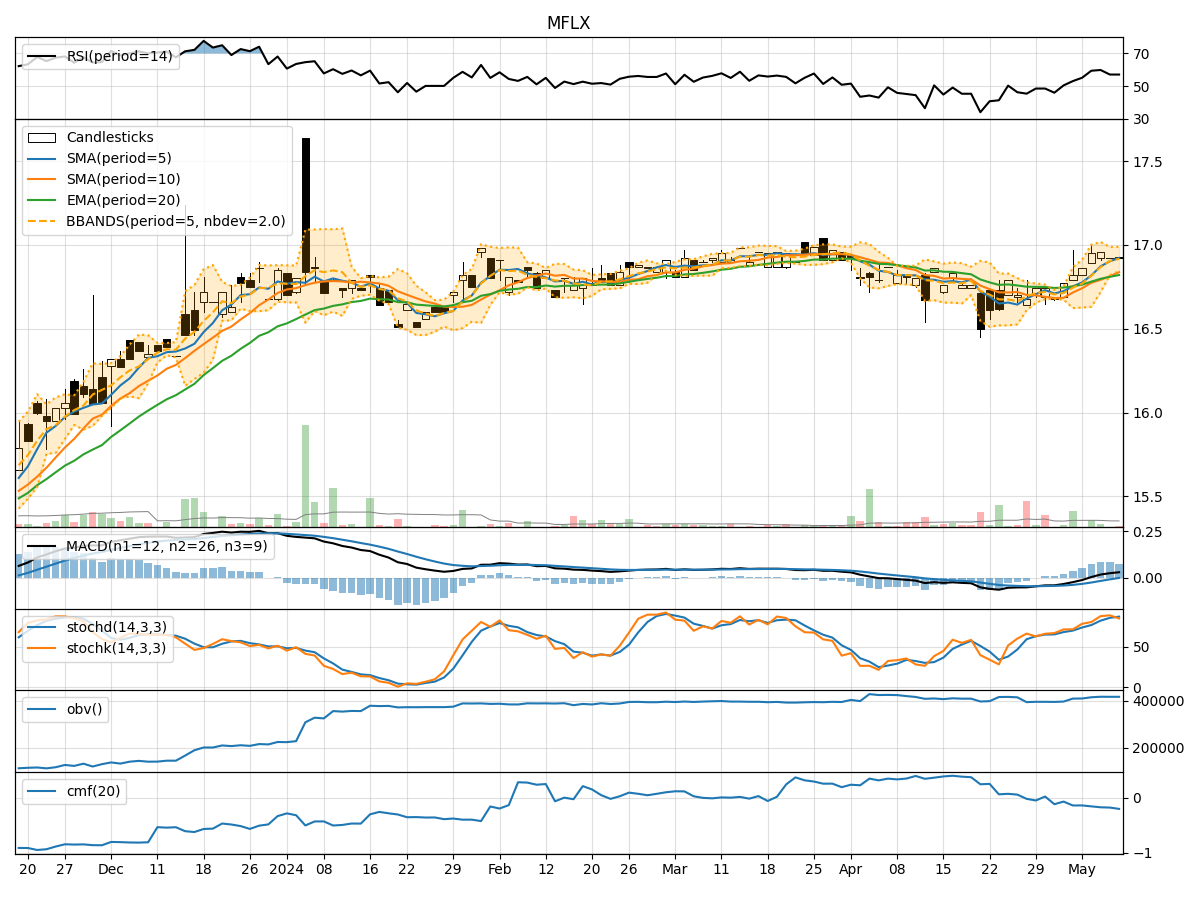
In analyzing the technical indicators for MFLX over the last 5 days, we will delve into the trends, momentum, volatility, and volume aspects to provide a comprehensive outlook on the possible stock price movement. By examining key indicators such as moving averages, MACD, RSI, Bollinger Bands, and OBV, we aim to offer valuable insights and predictions for the upcoming days.
Trend Analysis:
- Moving Averages (MA): The 5-day MA has been consistently above the closing prices, indicating a short-term uptrend.
- MACD: The MACD line has been above the signal line, suggesting bullish momentum.
- EMA: The EMA has been trending upwards, supporting the bullish sentiment.
Key Observation: The trend indicators point towards a bullish outlook for MFLX.
Momentum Analysis:
- RSI: The RSI has been in the neutral to slightly overbought territory, indicating moderate buying pressure.
- Stochastic Oscillator: Both %K and %D have been in the overbought zone, signaling potential for a pullback.
- Williams %R: The indicator has been in the oversold region, suggesting a possible reversal.
Key Observation: Momentum indicators show a mixed signal, with a slight bias towards a bearish divergence.
Volatility Analysis:
- Bollinger Bands (BB): The stock price has been trading within the bands, indicating normal volatility.
- BB Width: The bands have been relatively narrow, suggesting a period of consolidation.
Key Observation: Volatility indicators suggest a sideways movement or consolidation phase.
Volume Analysis:
- On-Balance Volume (OBV): The OBV has been relatively flat, indicating a balance between buying and selling pressure.
- Chaikin Money Flow (CMF): The CMF has been negative, reflecting a lack of strong buying interest.
Key Observation: Volume indicators point towards a neutral stance with no clear direction.
Conclusion:
Based on the analysis of trend, momentum, volatility, and volume indicators, the next few days for MFLX could see a mixed price movement. While the trend indicators suggest a bullish outlook, momentum indicators indicate a potential bearish divergence. Volatility signals a sideways movement, and volume indicators show a neutral stance.
Recommendation:
Considering the overall analysis, it is advisable to exercise caution in trading MFLX in the upcoming days. Traders may consider waiting for more clarity in price direction before taking significant positions. Keep a close watch on key support and resistance levels to gauge potential breakout or reversal points.
Disclaimer:
Remember that technical analysis is not a guaranteed predictor of future price movements, and other fundamental factors can influence stock prices. It is essential to conduct thorough research and consider multiple indicators before making any trading decisions. Consulting with a financial advisor can provide personalized insights tailored to your investment goals and risk tolerance.