Technical Analysis of MFUL 2024-05-10
Overview:
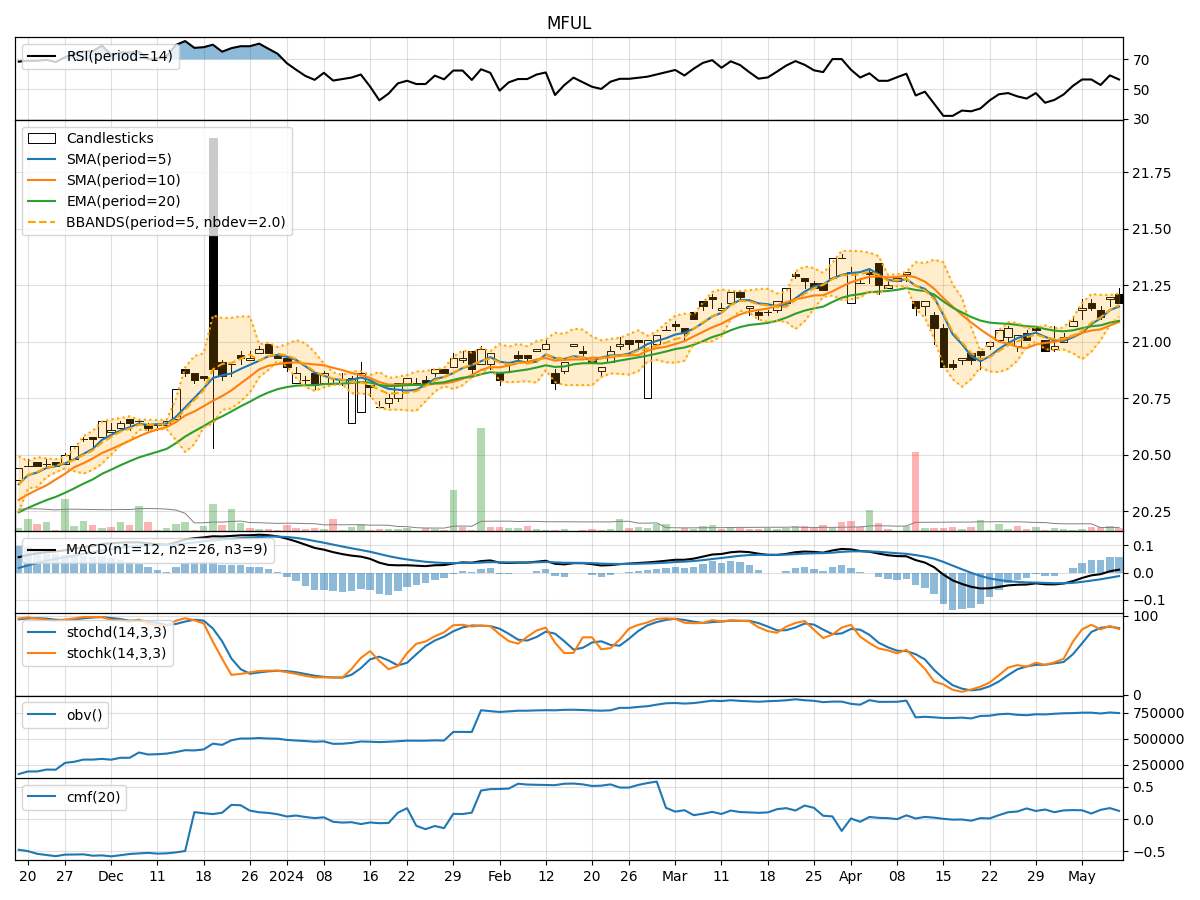
In analyzing the technical indicators for MFUL stock over the last 5 days, we will delve into the trend, momentum, volatility, and volume indicators to provide a comprehensive outlook on the possible stock price movement in the coming days. By examining key metrics such as moving averages, MACD, RSI, Bollinger Bands, and OBV, we aim to offer valuable insights and predictions for potential price action.
Trend Indicators:
- Moving Averages (MA): The 5-day MA has been trending slightly above the closing prices, indicating a short-term uptrend.
- MACD: The MACD line has been consistently positive, suggesting bullish momentum.
- MACD Histogram: The histogram has been increasing, indicating strengthening bullish momentum.
Key Observation: The trend indicators suggest a bullish sentiment in the short term.
Momentum Indicators:
- RSI: The RSI values have been fluctuating around the neutral zone, indicating a lack of strong momentum.
- Stochastic Oscillator: Both %K and %D values have been fluctuating, showing indecision in momentum.
- Williams %R: The values have been hovering around oversold levels, suggesting a potential reversal.
Key Observation: Momentum indicators reflect a mixed sentiment with no clear direction.
Volatility Indicators:
- Bollinger Bands: The stock price has been trading within the bands, indicating normal volatility.
- Bollinger %B: The %B values have been fluctuating within the bands, showing no extreme conditions.
Key Observation: Volatility indicators suggest a stable price movement with no significant deviations.
Volume Indicators:
- On-Balance Volume (OBV): The OBV values have been fluctuating, indicating mixed buying and selling pressure.
- Chaikin Money Flow (CMF): The CMF values have been positive, suggesting a slight inflow of money into the stock.
Key Observation: Volume indicators show a neutral stance with no clear dominance of buying or selling pressure.
Conclusion:
Based on the analysis of the technical indicators, the stock price of MFUL is likely to experience sideways movement in the coming days. While trend indicators signal a bullish sentiment in the short term, momentum indicators show a lack of clear direction. Volatility indicators suggest stable price movement, and volume indicators reflect mixed buying and selling pressure.
Overall, the stock is expected to consolidate in the near future, with potential fluctuations within a narrow range. Traders may consider adopting a range-bound strategy until a clear trend emerges in the market. It is crucial to monitor key levels and wait for a decisive breakout or breakdown before taking significant trading positions.
Disclaimer:
This analysis is based on historical data and technical indicators, and market conditions can change rapidly. It is essential to conduct thorough research and consider other fundamental factors before making investment decisions. Consulting with a financial advisor is recommended to align your investment strategies with your financial goals and risk tolerance.