Technical Analysis of MFUS 2024-05-10
Overview:
In analyzing the technical indicators for MFUS over the last 5 days, we will delve into the trend, momentum, volatility, and volume indicators to provide a comprehensive outlook on the possible stock price movement in the coming days. By examining these key aspects, we aim to offer valuable insights and predictions for potential investors.
Trend Indicators:
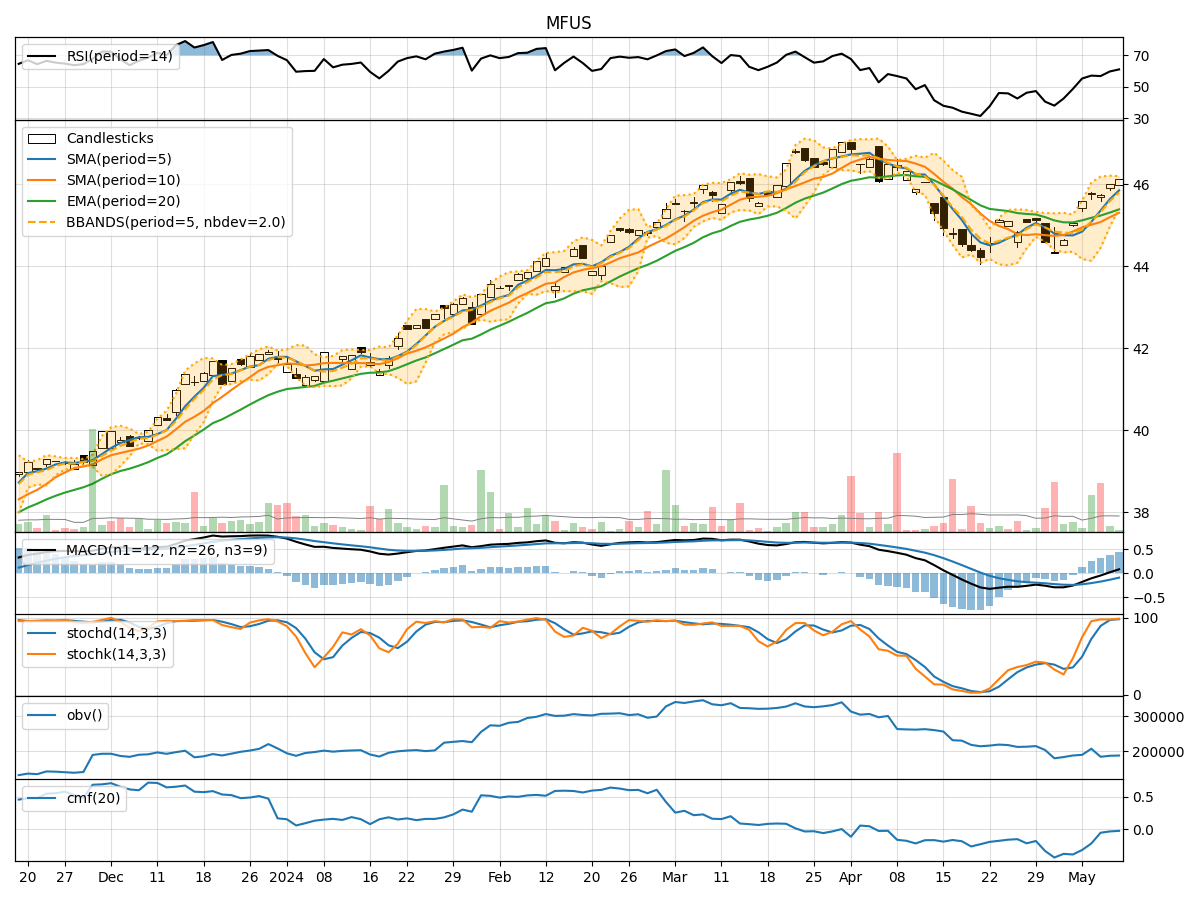
- Moving Averages (MA): The 5-day moving average has been consistently above the simple moving average (SMA) and exponential moving average (EMA), indicating a short-term uptrend.
- MACD: The MACD line has been above the signal line, suggesting bullish momentum in the stock price.
- MACD Histogram: The histogram has been increasing, indicating strengthening bullish momentum.
Momentum Indicators:
- RSI: The Relative Strength Index (RSI) has been trending upwards, showing increasing buying pressure.
- Stochastic Oscillator: Both %K and %D have been in the overbought zone, signaling a potential reversal or consolidation.
- Williams %R: The Williams %R is at or near oversold levels, suggesting a possible buying opportunity.
Volatility Indicators:
- Bollinger Bands: The stock price has been trading within the Bollinger Bands, with the bands narrowing, indicating decreasing volatility.
- Bollinger %B: The %B indicator is above 0.5, suggesting a bullish trend.
Volume Indicators:
- On-Balance Volume (OBV): The OBV has been declining, indicating selling pressure in the stock.
- Chaikin Money Flow (CMF): The CMF has been negative, reflecting a lack of buying interest.
Key Observations and Opinions:
- Trend: The stock is in an upward trend based on moving averages and MACD analysis.
- Momentum: Momentum indicators suggest a potential reversal or consolidation due to overbought conditions.
- Volatility: Volatility is decreasing, indicating a possible period of consolidation.
- Volume: The declining OBV and negative CMF signal weak buying interest.
Conclusion:
Based on the analysis of the technical indicators, the next few days' possible stock price movement for MFUS is likely to experience consolidation or a minor pullback. While the trend remains bullish, the overbought momentum indicators and declining volume indicators suggest a temporary pause in the upward movement. Investors should monitor key support levels and wait for clearer signals before making trading decisions.