Technical Analysis of MGMT 2024-05-10
Overview:
In analyzing the technical indicators for MGMT stock over the last 5 days, we will delve into the trend, momentum, volatility, and volume indicators to provide a comprehensive outlook on the possible stock price movement in the coming days. By examining these key aspects, we aim to offer valuable insights and predictions for informed decision-making.
Trend Analysis:
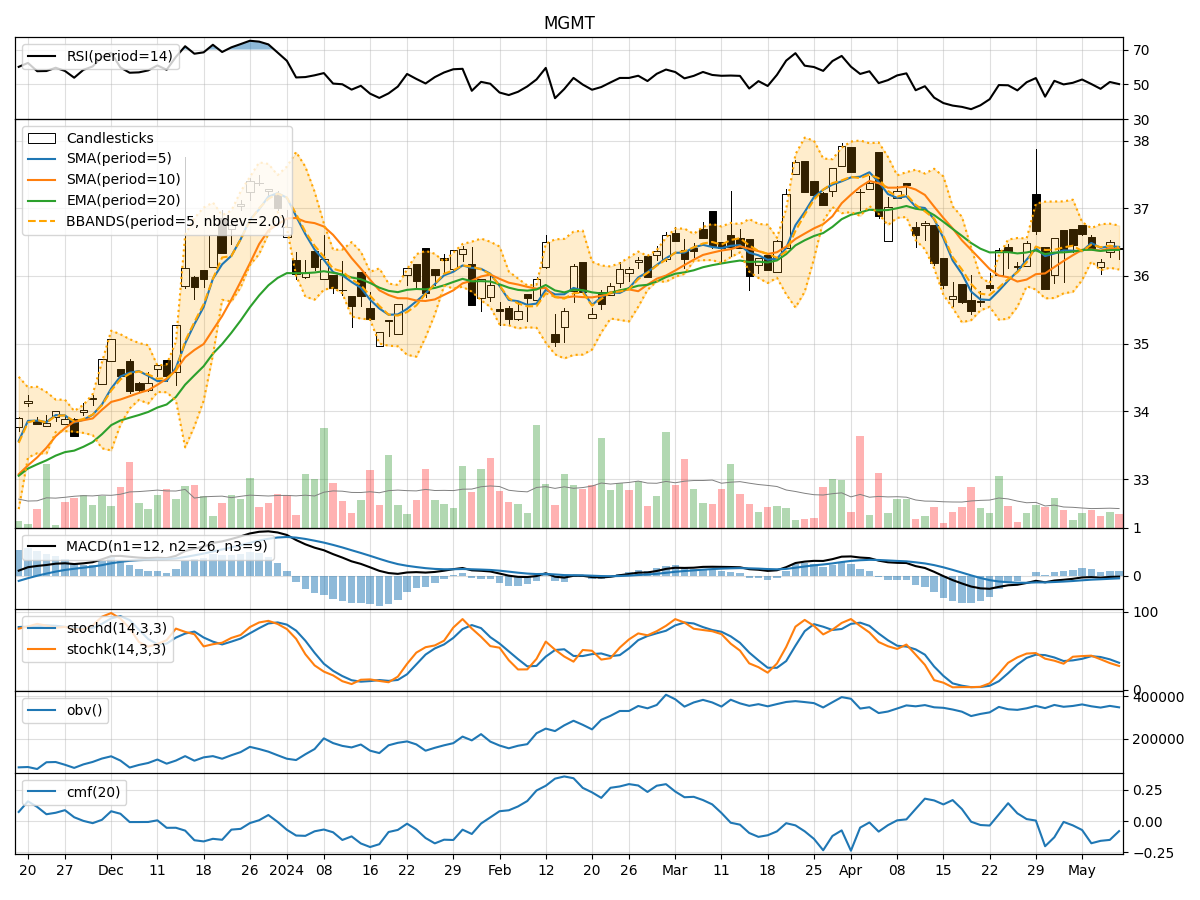
- Moving Averages (MA): The 5-day Moving Average (MA) has been fluctuating around the closing prices, indicating a relatively stable trend.
- MACD: The Moving Average Convergence Divergence (MACD) has been negative but showing signs of convergence towards the signal line, suggesting a potential reversal.
- RSI: The Relative Strength Index (RSI) has been hovering around the neutral zone, indicating a balanced momentum.
Momentum Analysis:
- Stochastic Oscillator: Both %K and %D have been declining, signaling a bearish momentum.
- Williams %R: The Williams %R is in the oversold territory, indicating a potential reversal in the short term.
Volatility Analysis:
- Bollinger Bands: The Bollinger Bands are relatively narrow, suggesting low volatility in the stock price.
- Average True Range (ATR): The ATR values have been relatively stable, indicating consistent price movements.
Volume Analysis:
- On-Balance Volume (OBV): The OBV has been fluctuating, indicating indecision among investors.
- Chaikin Money Flow (CMF): The CMF has been negative, suggesting outflow of money from the stock.
Key Observations:
- The stock is currently in a consolidation phase with mixed signals from different indicators.
- The MACD convergence and RSI neutrality indicate a potential reversal or sideways movement.
- The bearish momentum from the Stochastic Oscillator and oversold condition from Williams %R suggest a short-term downward pressure.
- The low volatility and fluctuating volume indicate a lack of clear direction in the stock price.
Conclusion:
Based on the analysis of the technical indicators, the stock price of MGMT is likely to experience further consolidation in the coming days. The mixed signals from the trend, momentum, volatility, and volume indicators suggest a lack of strong bullish or bearish momentum. Traders should exercise caution and closely monitor key levels for potential breakout or breakdown scenarios. Overall, the outlook for MGMT stock is neutral with a slight bearish bias in the short term.