Technical Analysis of MGNR 2024-05-10
Overview:
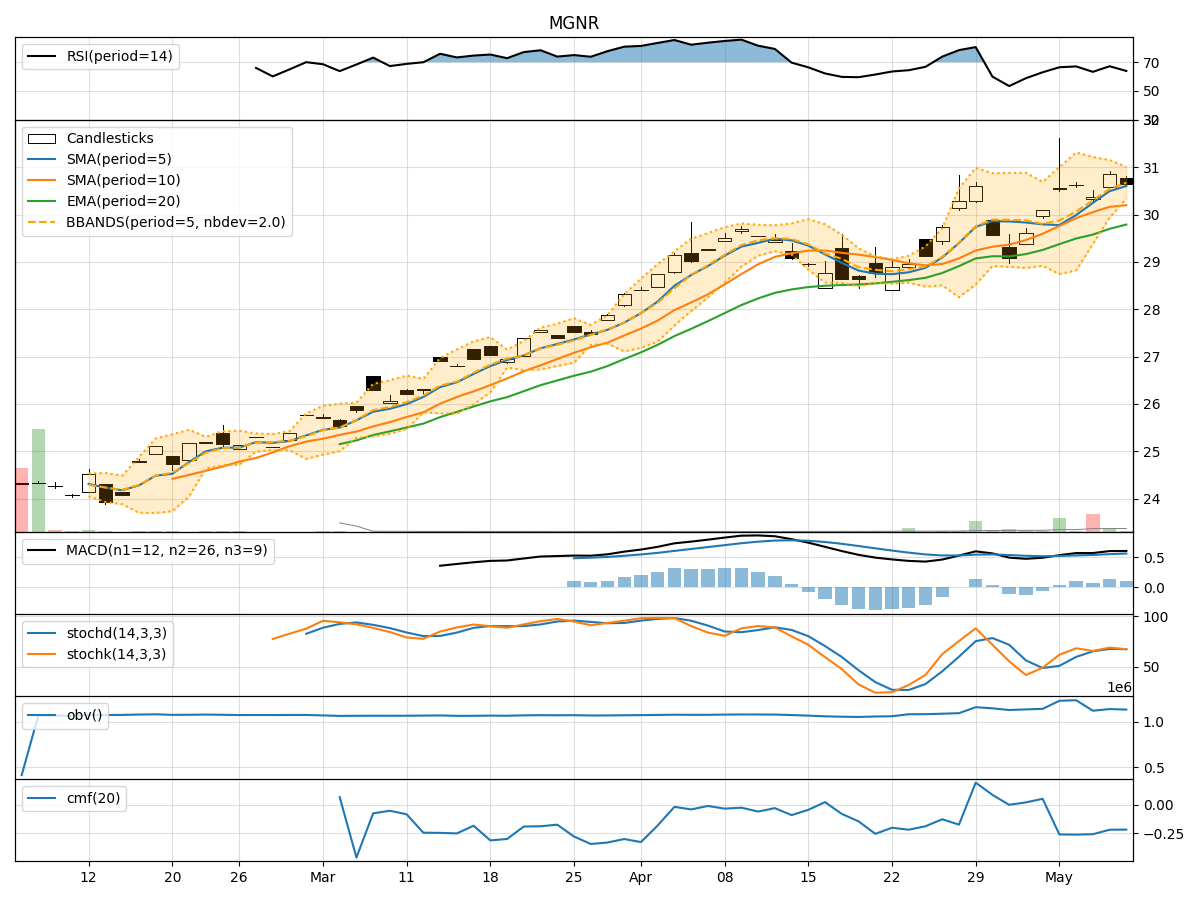
In analyzing the technical indicators for MGNR over the last 5 days, we will delve into the trend, momentum, volatility, and volume indicators to provide a comprehensive outlook on the possible stock price movement in the coming days.
Trend Indicators:
- Moving Averages (MA): The 5-day Moving Average (MA) has been consistently above the Simple Moving Average (SMA) and Exponential Moving Average (EMA), indicating a bullish trend.
- MACD: The MACD line has been consistently above the signal line, with both lines showing an upward trend, suggesting bullish momentum.
- MACD Histogram: The MACD Histogram has been positive, indicating increasing bullish momentum.
Momentum Indicators:
- RSI: The Relative Strength Index (RSI) has been fluctuating around the overbought territory, suggesting a strong bullish momentum.
- Stochastic Oscillator: Both %K and %D lines of the Stochastic Oscillator have been in the overbought zone, indicating a strong bullish momentum.
- Williams %R: The Williams %R has been hovering in the oversold territory, indicating a potential reversal to the upside.
Volatility Indicators:
- Bollinger Bands: The stock price has been trading within the Bollinger Bands, with the bands narrowing, indicating decreasing volatility.
- Bollinger %B: The %B indicator has been fluctuating around the middle range, suggesting a neutral stance in terms of volatility.
Volume Indicators:
- On-Balance Volume (OBV): The OBV has been fluctuating, indicating mixed buying and selling pressure.
- Chaikin Money Flow (CMF): The CMF has been negative, suggesting a bearish money flow into the stock.
Key Observations and Opinions:
- Trend: The trend indicators point towards a strong bullish sentiment in the stock.
- Momentum: Momentum indicators also support the bullish outlook, with RSI and Stochastic Oscillator signaling strong buying momentum.
- Volatility: Volatility has been decreasing, indicating a potential period of consolidation or sideways movement.
- Volume: The volume indicators show mixed signals, with OBV fluctuating and CMF indicating bearish money flow.
Conclusion:
Based on the analysis of the technical indicators, the next few days for MGNR are likely to see continued upward movement in the stock price. The strong bullish trend and momentum indicators suggest that the stock is poised for further gains. However, the decreasing volatility and mixed volume signals may lead to some consolidation before the next leg up. Traders and investors should consider capitalizing on potential buying opportunities during any consolidation phases to benefit from the overall bullish trend in MGNR.