Technical Analysis of MGOV 2024-05-10
Overview:
In analyzing the technical indicators for MGOV over the last 5 days, we will delve into the trend, momentum, volatility, and volume indicators to provide a comprehensive outlook on the possible stock price movement in the coming days. By examining these key aspects, we aim to offer valuable insights and predictions to guide your investment decisions.
Trend Analysis:
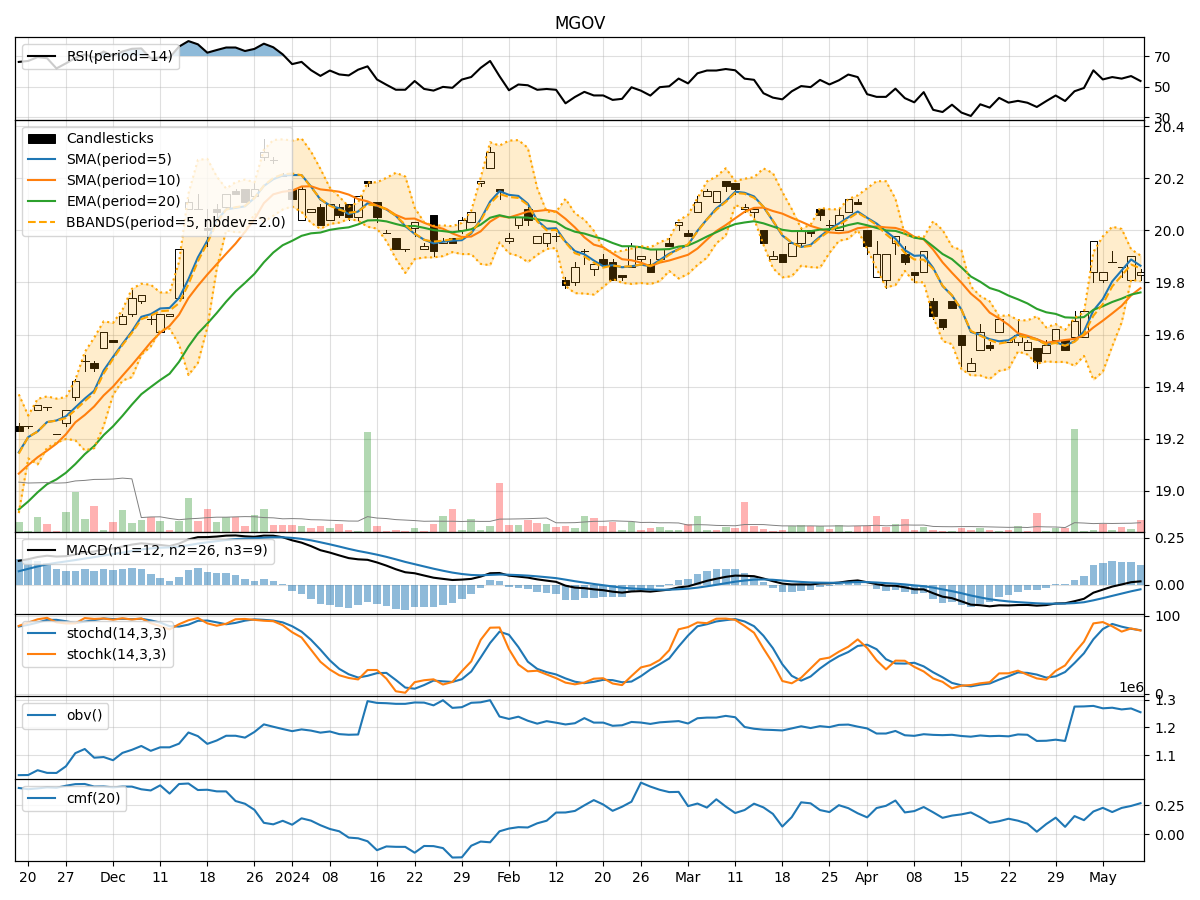
- Moving Averages (MA): The 5-day Moving Average (MA) has been consistently above the Simple Moving Average (SMA) and Exponential Moving Average (EMA), indicating a short-term bullish trend.
- MACD: The Moving Average Convergence Divergence (MACD) has shown positive values, with the MACD line consistently above the Signal line, suggesting bullish momentum.
- Conclusion: The trend indicators point towards an upward trend in the stock price.
Momentum Analysis:
- RSI: The Relative Strength Index (RSI) has been fluctuating around the neutral 50 level, indicating a balanced momentum in the stock.
- Stochastic Oscillator: Both %K and %D have been hovering around the mid-range, reflecting a lack of strong momentum.
- Conclusion: The momentum indicators suggest a sideways movement in the stock price.
Volatility Analysis:
- Bollinger Bands (BB): The stock price has mostly remained within the Bollinger Bands, with the bands narrowing over the last few days, indicating decreasing volatility.
- Conclusion: Volatility indicators signal a consolidation phase in the stock price.
Volume Analysis:
- On-Balance Volume (OBV): The OBV has shown mixed movements, indicating indecision among investors regarding the stock.
- Chaikin Money Flow (CMF): The CMF has been positive, suggesting some buying pressure in the stock.
- Conclusion: Volume indicators imply a neutral stance in the stock price.
Overall Conclusion:
Based on the analysis of trend, momentum, volatility, and volume indicators, the next few days' possible stock price movement for MGOV is likely to be sideways with a slight upward bias. While the trend indicators point towards an upward trajectory, the momentum and volume indicators suggest a lack of strong conviction among market participants, leading to a potential consolidation phase with mild bullish undertones.
It is essential to monitor the stock closely for any significant shifts in the technical indicators that could alter this outlook. Additionally, considering external factors and market developments alongside technical analysis can provide a more holistic view for making informed investment decisions.