Technical Analysis of MID.ETF 2024-05-10
Overview:
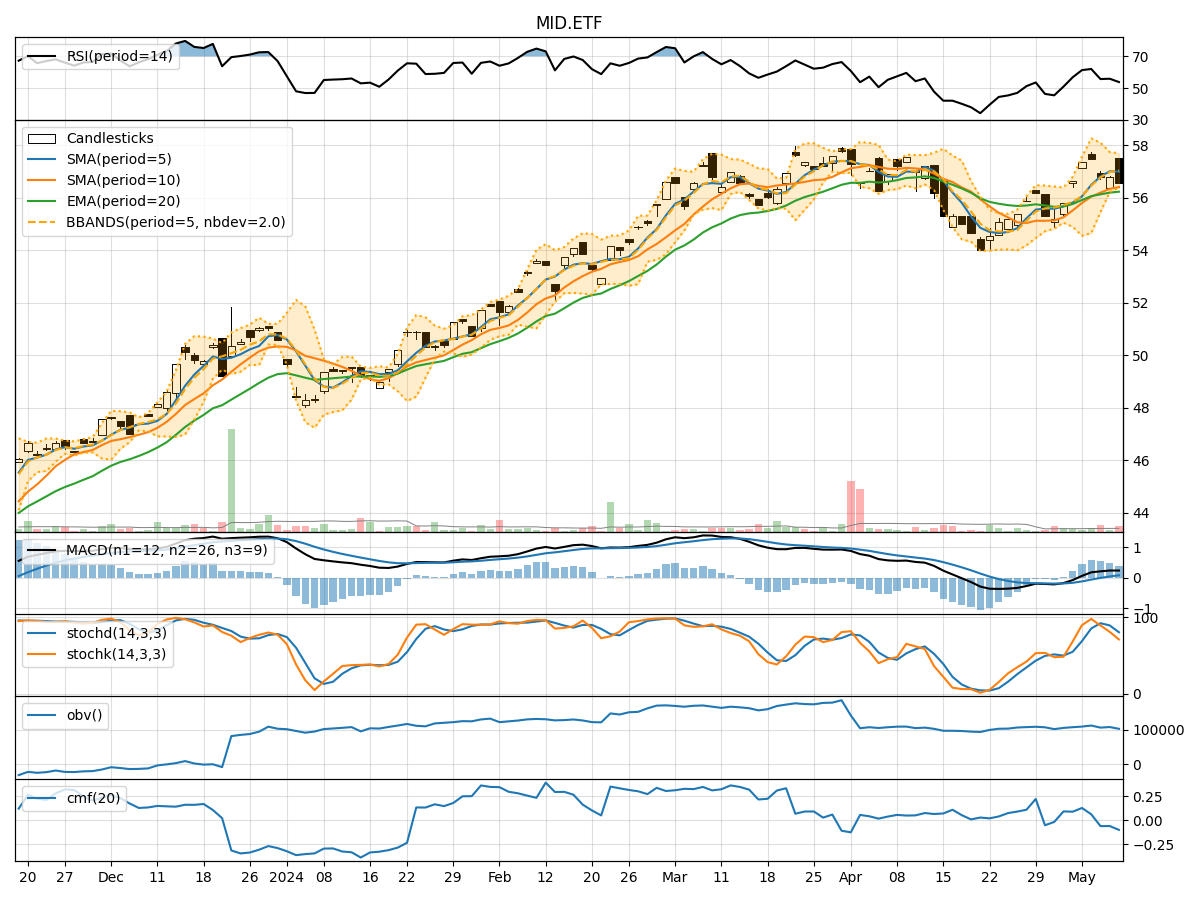
In the last 5 trading days, MID.ETF has shown mixed signals across various technical indicators. The stock price has been fluctuating within a certain range, indicating indecision in the market. We will analyze the trend, momentum, volatility, and volume indicators to determine the possible future stock price movement.
Trend Indicators:
- Moving averages (MA) show a slight uptrend, with the 5-day MA consistently above the 10-day simple moving average (SMA).
- Exponential moving average (EMA) has been relatively flat, suggesting a lack of strong trend direction.
- Moving Average Convergence Divergence (MACD) has been positive but decreasing, indicating a potential slowdown in the uptrend.
Momentum Indicators:
- Relative Strength Index (RSI) has been fluctuating around the neutral level of 50, indicating a lack of strong momentum.
- Stochastic oscillators show overbought conditions in the earlier days but have since corrected, suggesting a possible shift in momentum.
- Williams %R (WILLR) is in oversold territory, indicating a potential buying opportunity.
Volatility Indicators:
- Bollinger Bands (BB) have been narrowing, indicating decreasing volatility.
- The lower band of the Bollinger Bands has been acting as support, potentially limiting downside risk.
Volume Indicators:
- On-Balance Volume (OBV) has been negative, suggesting more selling pressure in the market.
- Chaikin Money Flow (CMF) has been negative, indicating outflows from the stock.
Key Observations and Opinions:
- Trend: The trend is slightly bullish but lacks strong momentum.
- Momentum: Momentum is neutral to slightly bearish, with signs of a potential reversal.
- Volatility: Volatility is decreasing, which could lead to a period of consolidation.
- Volume: Negative volume indicators suggest caution, as selling pressure may continue.
Conclusion:
Based on the analysis of technical indicators, the MID.ETF is likely to experience sideways movement in the next few days. The lack of strong trend direction, mixed momentum signals, decreasing volatility, and negative volume indicators indicate a period of consolidation. Traders should exercise caution and wait for clearer signals before taking significant positions.