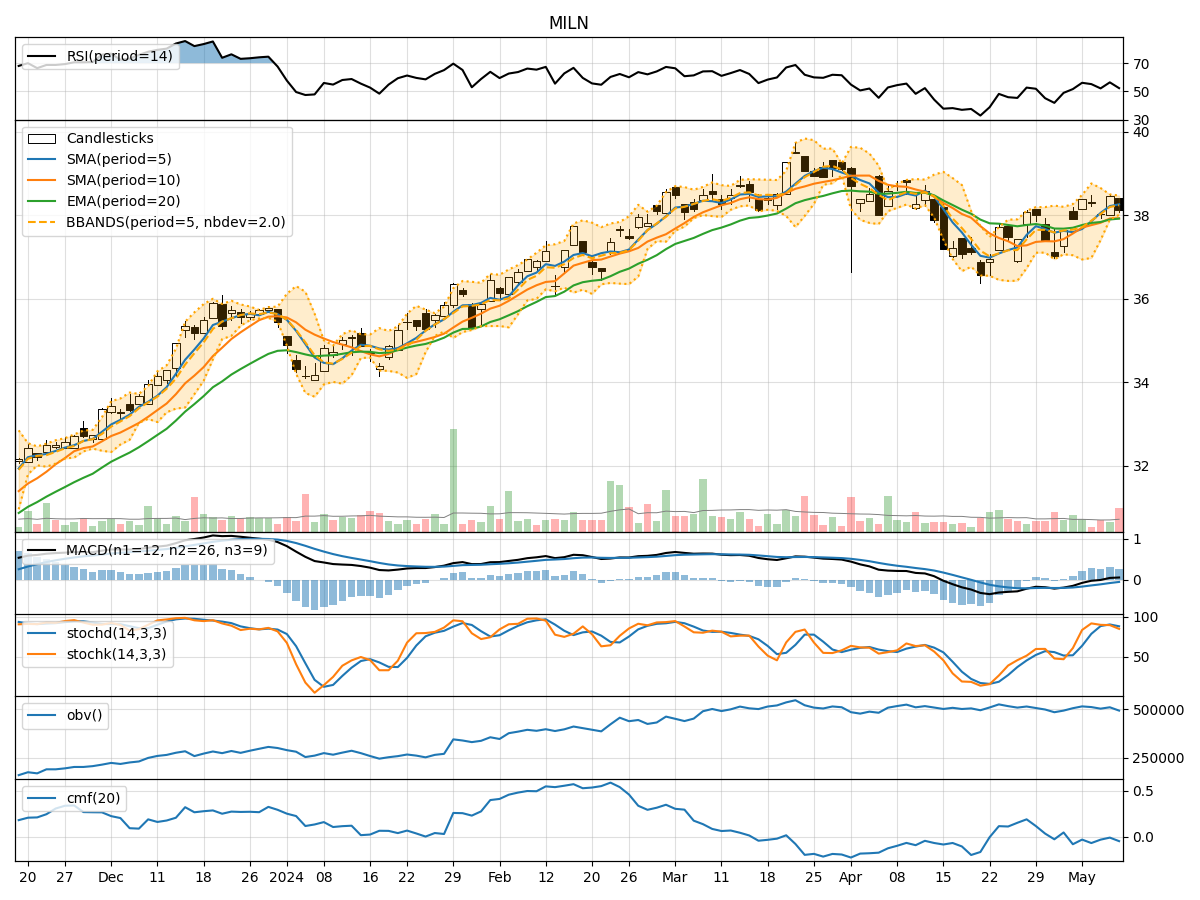
Technical Analysis of MILN 2024-05-10
Overview:
In analyzing the technical indicators for MILN over the last 5 days, we will delve into the trend, momentum, volatility, and volume indicators to provide a comprehensive outlook on the possible stock price movement in the coming days. By examining these key indicators, we aim to offer valuable insights and predictions for informed decision-making.
Trend Indicators:
- Moving Averages (MA): The 5-day Moving Average (MA) has been consistently above the closing prices, indicating a bullish trend.
- MACD: The Moving Average Convergence Divergence (MACD) has shown positive values, suggesting a bullish momentum.
- EMA: The Exponential Moving Average (EMA) has been trending upwards, supporting the bullish sentiment.
Momentum Indicators:
- RSI: The Relative Strength Index (RSI) has been fluctuating around the neutral zone, indicating indecision in the market.
- Stochastic Oscillator: Both %K and %D have been relatively high, signaling potential overbought conditions.
- Williams %R: The Williams %R has been in the oversold territory, suggesting a possible reversal.
Volatility Indicators:
- Bollinger Bands (BB): The Bollinger Bands have been narrowing, indicating decreasing volatility.
- BB%: The %B indicator has been hovering around the middle, reflecting a balanced market sentiment.
Volume Indicators:
- On-Balance Volume (OBV): The OBV has shown a slight decrease, suggesting some distribution in the stock.
- Chaikin Money Flow (CMF): The CMF has been negative, indicating selling pressure in the market.
Key Observations:
- The trend indicators suggest a bullish sentiment with moving averages and MACD supporting upward momentum.
- Momentum indicators show mixed signals with RSI indicating neutrality, Stochastic Oscillator hinting at overbought conditions, and Williams %R signaling a possible reversal.
- Volatility indicators point towards decreasing volatility, potentially leading to a consolidation phase.
- Volume indicators reflect some distribution and selling pressure in the market.
Conclusion:
Based on the analysis of the technical indicators, the next few days for MILN could see sideways movement with a slight bearish bias. The bullish trend may lose momentum due to overbought conditions and selling pressure indicated by the momentum and volume indicators. The decreasing volatility suggests a possible consolidation phase, where the stock price might trade within a narrow range. Traders should exercise caution and consider waiting for clearer signals before making significant trading decisions.