Technical Analysis of MINV 2024-05-10
Overview:
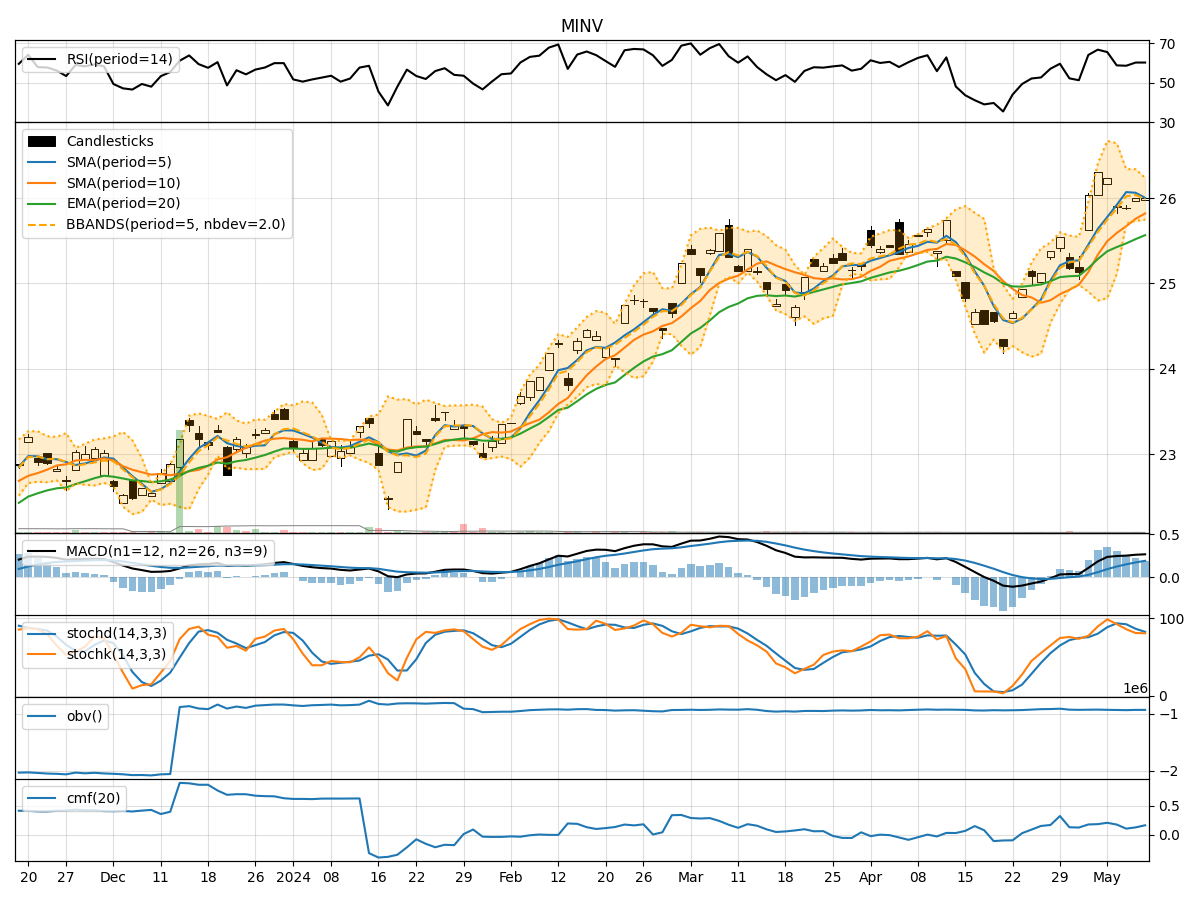
In analyzing the technical indicators for MINV stock over the last 5 days, we will delve into the trend, momentum, volatility, and volume indicators to provide a comprehensive assessment of the stock's potential price movement. By examining these key indicators, we aim to offer valuable insights and predictions for the next few days.
Trend Analysis:
- Moving Averages (MA): The 5-day Moving Average (MA) has been consistently above the Simple Moving Average (SMA) and Exponential Moving Average (EMA), indicating a bullish trend.
- MACD: The MACD line has been consistently above the signal line, suggesting a positive momentum in the stock price.
- MACD Histogram: The MACD Histogram has been increasing over the past 5 days, indicating strengthening bullish momentum.
Momentum Analysis:
- RSI: The Relative Strength Index (RSI) has been fluctuating around the 60-65 range, indicating a neutral momentum.
- Stochastic Oscillator: Both %K and %D lines of the Stochastic Oscillator have been declining, suggesting a potential reversal in momentum.
- Williams %R: The Williams %R is in the oversold territory, indicating a possible buying opportunity.
Volatility Analysis:
- Bollinger Bands: The stock price has been trading within the Bollinger Bands, with the bands narrowing over the last few days, indicating decreasing volatility.
- Bollinger %B: The %B indicator is hovering around 0.5, suggesting a neutral stance in terms of volatility.
Volume Analysis:
- On-Balance Volume (OBV): The OBV has been relatively stable, indicating a balance between buying and selling pressure.
- Chaikin Money Flow (CMF): The CMF has been gradually increasing, indicating a potential inflow of money into the stock.
Conclusion:
Based on the analysis of the technical indicators: - Trend: The stock is in an upward trend supported by moving averages and MACD. - Momentum: The momentum is neutral to slightly bearish based on RSI and Stochastic Oscillator. - Volatility: Volatility is decreasing, as indicated by the narrowing Bollinger Bands. - Volume: The volume indicators suggest a balanced market sentiment.
Overall View:
Considering the overall technical analysis, the stock is likely to experience consolidation in the near term, with a potential for a slight pullback in price due to the neutral to slightly bearish momentum indicators. Traders may consider waiting for a clearer signal or confirmation of a new trend before making significant trading decisions.