Technical Analysis of MISL 2024-05-10
Overview:
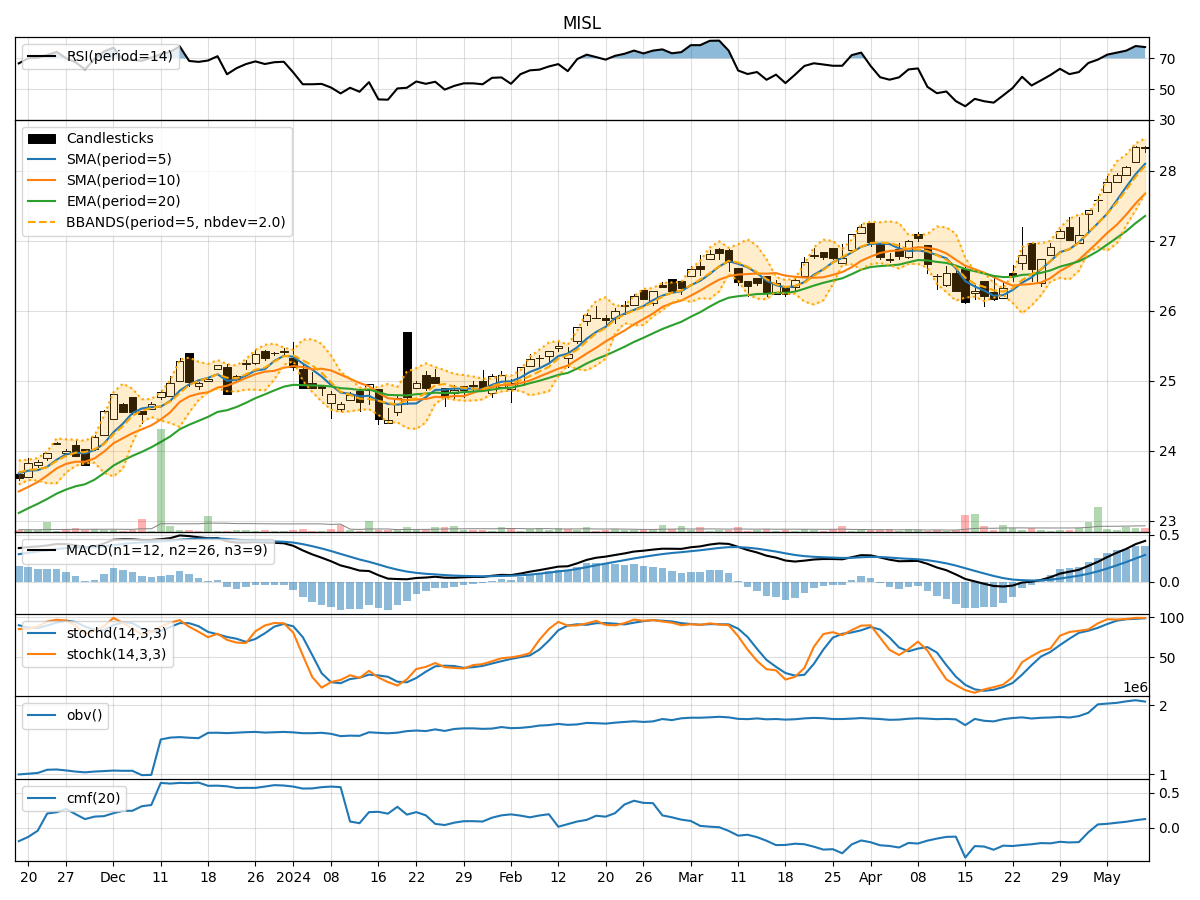
In analyzing the technical indicators for MISL stock over the last 5 days, we will delve into the trends, momentum, volatility, and volume aspects to provide a comprehensive outlook on the possible stock price movement in the coming days. By examining key indicators such as moving averages, MACD, RSI, Bollinger Bands, and OBV, we aim to offer valuable insights and predictions for potential price action.
Trend Analysis:
- Moving Averages (MA): The 5-day moving average has been consistently trending upwards, indicating a positive momentum in the stock price.
- MACD: The MACD line has been above the signal line for the past 5 days, suggesting a bullish trend.
Key Observation: The stock is in an upward trend based on moving averages and MACD.
Momentum Analysis:
- RSI: The Relative Strength Index (RSI) has been increasing steadily and is currently in the overbought territory, signaling strong buying momentum.
- Stochastic Oscillator: Both %K and %D lines are in the overbought zone, indicating a potential reversal or consolidation.
Key Observation: Momentum indicators suggest the stock is overbought and may experience a pullback.
Volatility Analysis:
- Bollinger Bands: The stock price has been trading within the upper Bollinger Band, indicating high volatility and potential overbought conditions.
Key Observation: Volatility is high, and the stock may be overextended.
Volume Analysis:
- On-Balance Volume (OBV): The OBV has been increasing, reflecting strong buying pressure and accumulation of the stock.
Key Observation: Volume indicators support the current bullish trend.
Conclusion:
Based on the analysis of the technical indicators, the next few days' possible stock price movement for MISL is likely to see a short-term pullback or consolidation. The stock is currently overbought based on momentum indicators and high volatility, suggesting a potential correction in the near future. However, the overall trend remains bullish, supported by moving averages and volume accumulation.
Key Conclusion: Expect a short-term correction or consolidation before a potential resumption of the bullish trend.