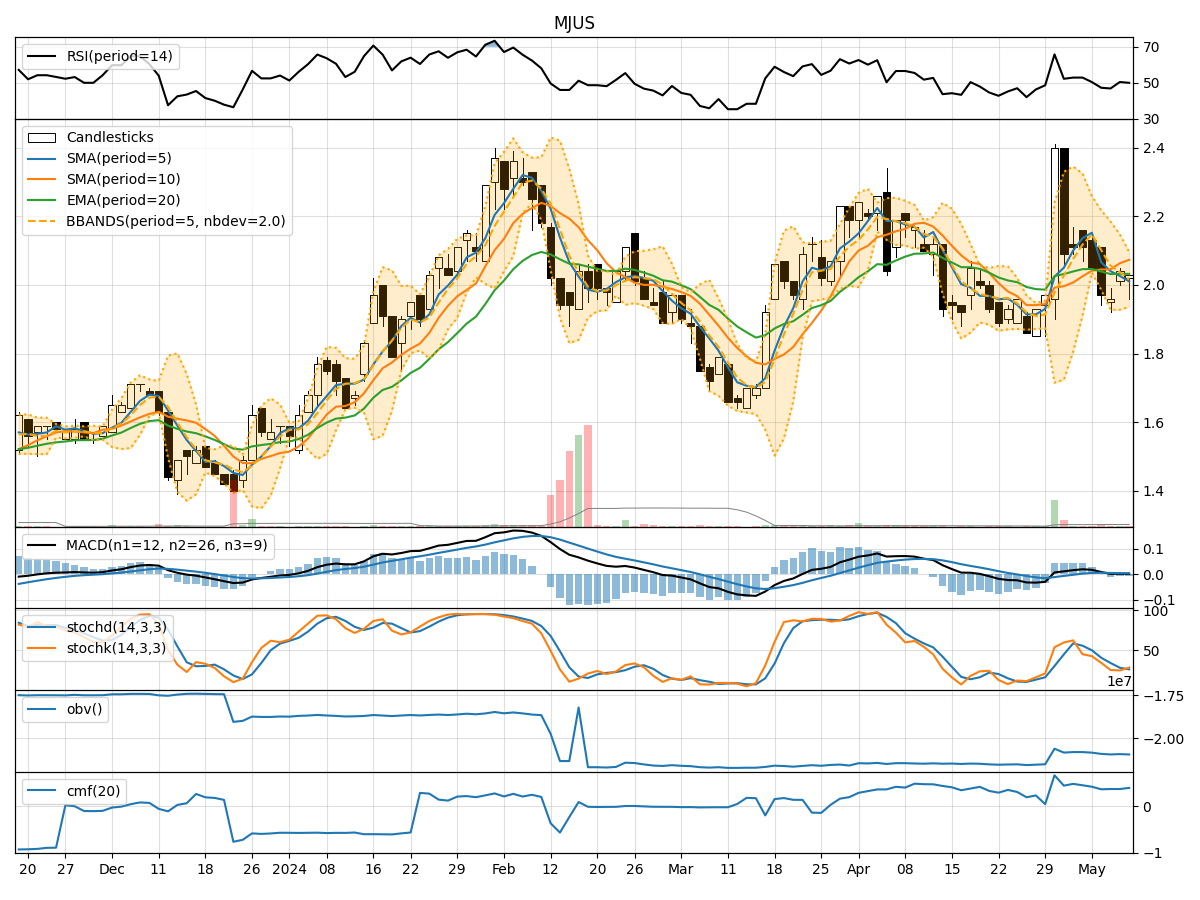
Technical Analysis of MJUS 2024-05-10
Overview:
In the last 5 trading days, MJUS stock has shown mixed signals across various technical indicators. The stock price has fluctuated within a narrow range, indicating indecision in the market. We will analyze the trend, momentum, volatility, and volume indicators to determine the possible future stock price movement.
Trend Analysis:
- Moving Averages (MA): The 5-day Moving Average (MA) has been below the Simple Moving Average (SMA) and Exponential Moving Average (EMA) for the past few days, indicating a short-term bearish trend.
- MACD: The MACD line has been fluctuating around the signal line, suggesting a lack of clear trend direction.
- Conclusion: The trend indicators show a bearish bias in the short term.
Momentum Analysis:
- RSI: The Relative Strength Index (RSI) has been hovering around 50, indicating a neutral momentum.
- Stochastic Oscillator: Both %K and %D have been in the oversold region, suggesting a potential reversal.
- Conclusion: The momentum indicators suggest a neutral to slightly bearish momentum.
Volatility Analysis:
- Bollinger Bands (BB): The stock price has been trading within the Bollinger Bands, with the bands narrowing, indicating reduced volatility.
- Conclusion: Volatility indicators point towards a consolidation phase with reduced price fluctuations.
Volume Analysis:
- On-Balance Volume (OBV): The OBV has been declining, indicating selling pressure in the stock.
- Chaikin Money Flow (CMF): The CMF has been positive but trending downwards, suggesting weakening buying pressure.
- Conclusion: Volume indicators signal bearish sentiment with decreasing buying interest.
Conclusion:
Based on the analysis of trend, momentum, volatility, and volume indicators, the next few days' possible stock price movement for MJUS is likely to be bearish. The trend indicators show a bearish bias, momentum is neutral to slightly bearish, volatility indicates consolidation, and volume signals bearish sentiment. Therefore, investors should exercise caution and consider potential short-selling opportunities or wait for a clearer bullish signal before considering long positions.
Key Points:
- Trend: Bearish
- Momentum: Neutral to Slightly Bearish
- Volatility: Consolidation
- Volume: Bearish
Recommendation:
Considering the overall technical analysis, it is advisable to monitor the stock closely for any potential reversal signals before considering long positions. Traders may explore short-selling opportunities in the short term until a clear bullish trend emerges. It is essential to set stop-loss levels and closely follow the price action to manage risk effectively.