Technical Analysis of MKOR 2024-05-10
Overview:
In analyzing the technical indicators for MKOR stock over the last 5 days, we will delve into the trends, momentum, volatility, and volume indicators to provide a comprehensive outlook on the possible stock price movement in the coming days. By examining these key indicators, we aim to offer valuable insights and recommendations for potential investors.
Trend Indicators:
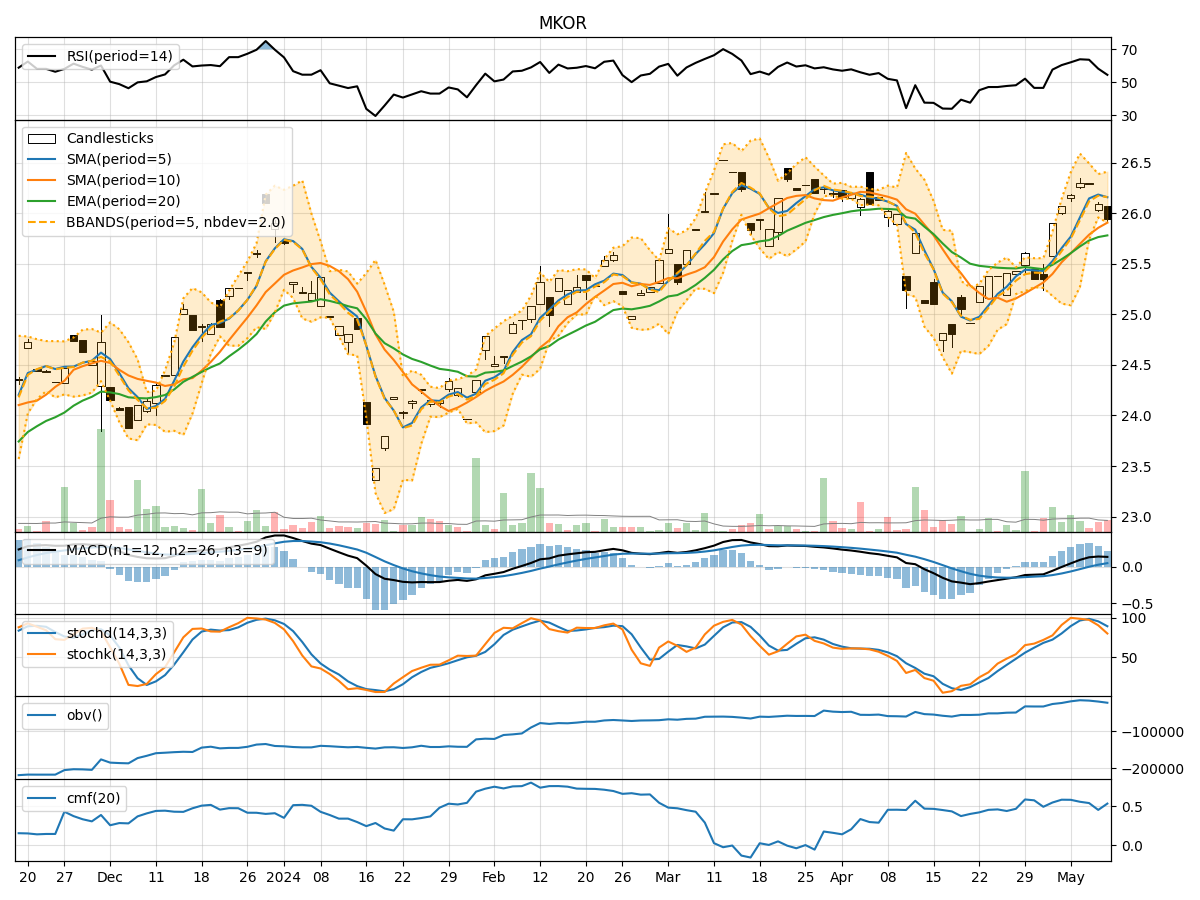
- Moving Averages (MA): The moving averages show a consistent uptrend over the last 5 days, with the closing price consistently above the short-term moving averages.
- MACD: The MACD line has been positive, indicating a bullish momentum in the stock price.
- EMA: The exponential moving average has been steadily increasing, reflecting a positive trend in the stock price.
Momentum Indicators:
- RSI: The Relative Strength Index has been fluctuating but generally staying within the neutral range, suggesting a balanced momentum.
- Stochastic Oscillator: The stochastic indicators have been gradually decreasing, indicating a potential slowdown in momentum.
- Williams %R: The Williams %R is in the oversold territory, signaling a possible reversal in the stock price.
Volatility Indicators:
- Bollinger Bands: The Bollinger Bands have been narrowing, indicating decreasing volatility in the stock price.
- Bollinger %B: The %B indicator is hovering around the middle range, suggesting a neutral stance in terms of volatility.
Volume Indicators:
- On-Balance Volume (OBV): The OBV has been fluctuating but generally maintaining a positive trend, indicating accumulation by investors.
- Chaikin Money Flow (CMF): The CMF has been positive, reflecting buying pressure in the stock.
Key Observations:
- The stock has shown a strong uptrend based on moving averages and MACD.
- Momentum indicators suggest a potential slowdown in the bullish momentum.
- Volatility has been decreasing, indicating a possible period of consolidation.
- Volume indicators show accumulation by investors, supporting the bullish sentiment.
Conclusion:
Based on the analysis of the technical indicators, the next few days for MKOR stock are likely to see sideways movement or consolidation. While the trend indicators remain bullish, the momentum indicators suggest a potential slowdown in momentum. The decreasing volatility and positive volume indicators indicate a period of stabilization in the stock price. Investors should closely monitor key support and resistance levels for potential entry or exit points.