Technical Analysis of MLN 2024-05-10
Overview:
In analyzing the technical indicators for MLN stock over the last 5 days, we will delve into the trend, momentum, volatility, and volume indicators to provide a comprehensive outlook on the possible stock price movement in the coming days. By examining these key indicators, we aim to offer valuable insights and predictions for informed decision-making.
Trend Analysis:
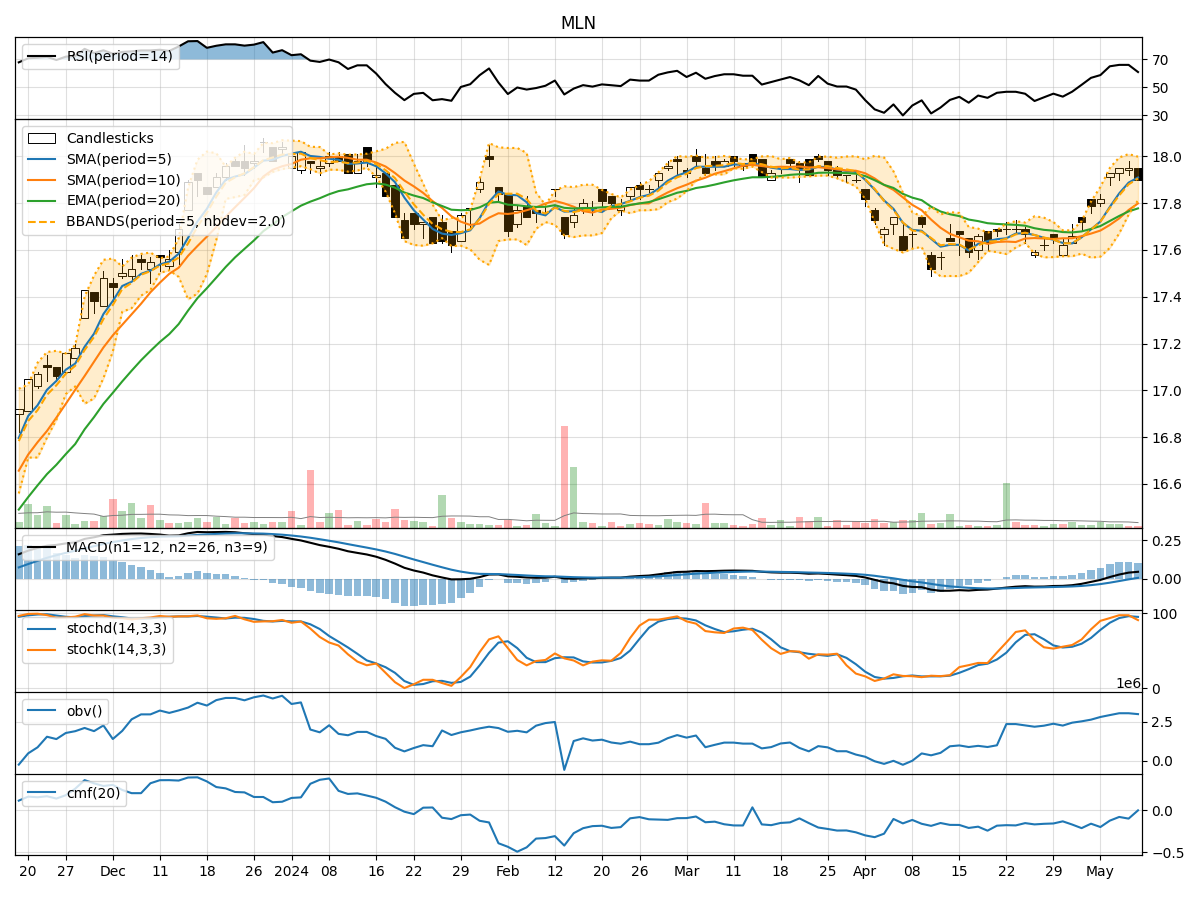
- Moving Averages (MA): The 5-day Moving Average (MA) has been consistently above the Simple Moving Average (SMA) and Exponential Moving Average (EMA), indicating a bullish trend.
- MACD: The MACD line has been consistently above the signal line, with the MACD Histogram showing an increasing trend, suggesting bullish momentum.
Momentum Analysis:
- RSI: The Relative Strength Index (RSI) has been in the neutral to overbought territory, indicating a potential overbought condition.
- Stochastic Oscillator: Both %K and %D have been in the overbought zone, signaling a potential reversal or consolidation.
Volatility Analysis:
- Bollinger Bands (BB): The stock price has been trading within the Bollinger Bands, with the bands narrowing, suggesting decreasing volatility.
- Bollinger %B: The %B indicator has been hovering around 0.5, indicating a neutral position within the bands.
Volume Analysis:
- On-Balance Volume (OBV): The OBV has been relatively flat, suggesting a balance between buying and selling pressure.
- Chaikin Money Flow (CMF): The CMF has been negative, indicating a bearish money flow trend.
Conclusion:
Based on the analysis of the technical indicators: - Trend: The stock is in an upward trend supported by moving averages and MACD. - Momentum: The momentum indicators suggest a potential overbought condition, signaling a need for caution. - Volatility: Volatility is decreasing, indicating a possible period of consolidation. - Volume: The volume indicators show a balance between buying and selling pressure, with a bearish money flow trend.
Forecast:
Considering the overall analysis, the next few days for MLN stock could see sideways movement or a slight pullback as the stock may consolidate after the recent bullish trend. Traders should monitor the overbought signals from momentum indicators and the decreasing volatility for potential entry or exit points. It is advisable to wait for clearer signals before making significant trading decisions.