Technical Analysis of MLPA 2024-05-10
Overview:
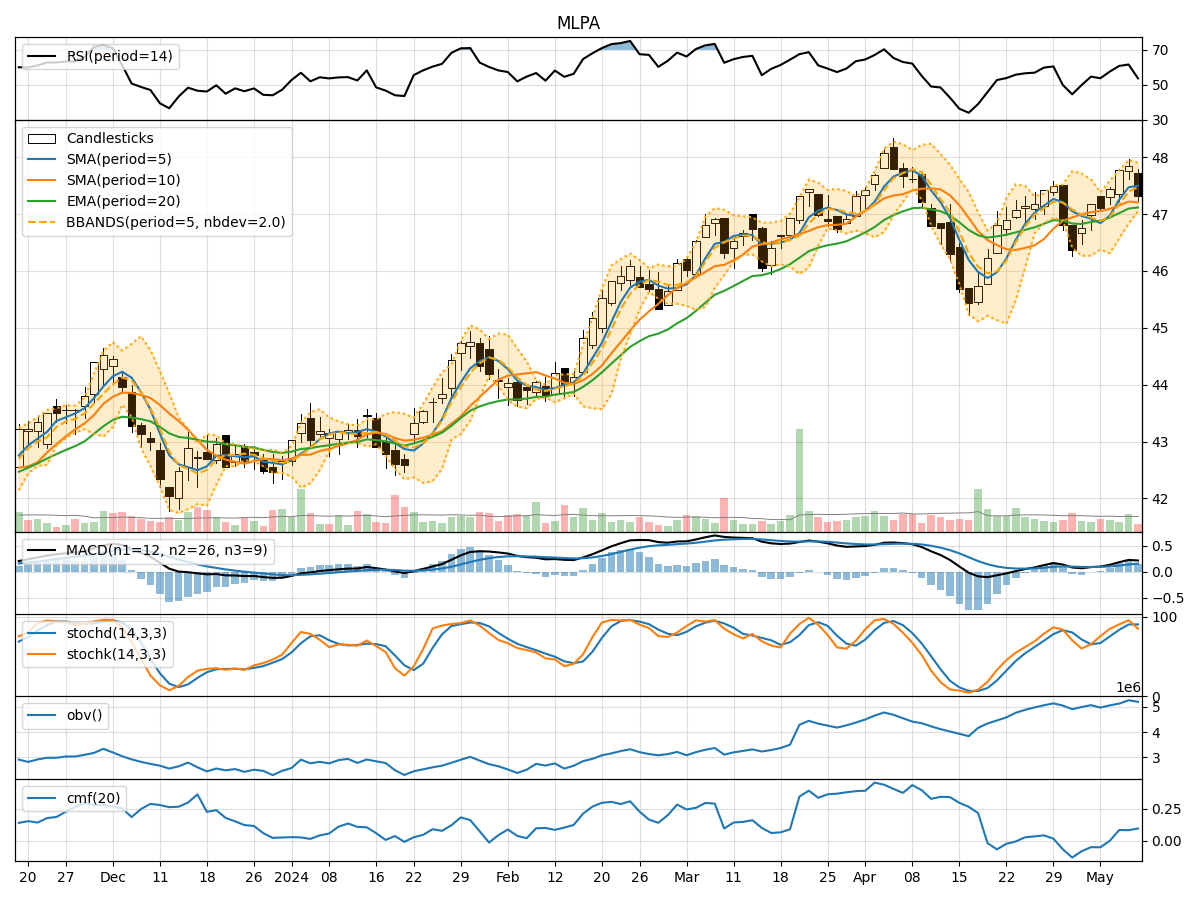
In the last 5 trading days, MLPA stock has shown a consistent uptrend in its closing price, accompanied by increasing trading volumes. The trend indicators such as Moving Averages and MACD suggest a bullish sentiment, supported by positive momentum and volatility indicators. The stock has also seen a steady increase in the On-Balance Volume (OBV) and Chaikin Money Flow (CMF) indicators, indicating strong buying pressure.
Trend Indicators Analysis:
- Moving Averages (MA): The 5-day Moving Average has been consistently above the closing price, indicating a bullish trend.
- MACD: The MACD line has been above the signal line for the past 5 days, suggesting a bullish momentum.
Momentum Indicators Analysis:
- RSI: The Relative Strength Index (RSI) has been in the overbought territory, indicating a strong bullish momentum.
- Stochastic Oscillator: Both %K and %D lines have been in the overbought zone, suggesting a potential reversal or consolidation.
Volatility Indicators Analysis:
- Bollinger Bands (BB): The stock price has been trading within the upper Bollinger Band, indicating an overbought condition.
Volume Indicators Analysis:
- On-Balance Volume (OBV): The OBV has been steadily increasing, reflecting strong accumulation by investors.
- Chaikin Money Flow (CMF): The CMF has been positive, indicating buying pressure in the stock.
Key Observations:
- The stock is currently in a strong bullish trend, supported by positive momentum and volume indicators.
- The overbought conditions in RSI and Stochastic Oscillator suggest a potential pullback or consolidation in the short term.
- The increasing OBV and CMF indicate strong buying interest in the stock.
Conclusion:
Based on the analysis of technical indicators, the next few days' possible stock price movement for MLPA is likely to experience a short-term pullback or consolidation due to the overbought conditions in RSI and Stochastic Oscillator. However, the overall trend remains bullish, supported by positive momentum and volume indicators. Traders may consider taking profits or waiting for a better entry point during the anticipated pullback. Long-term investors can continue to hold their positions, considering the strong buying pressure indicated by OBV and CMF.