Technical Analysis of MMCA 2024-05-10
Overview:
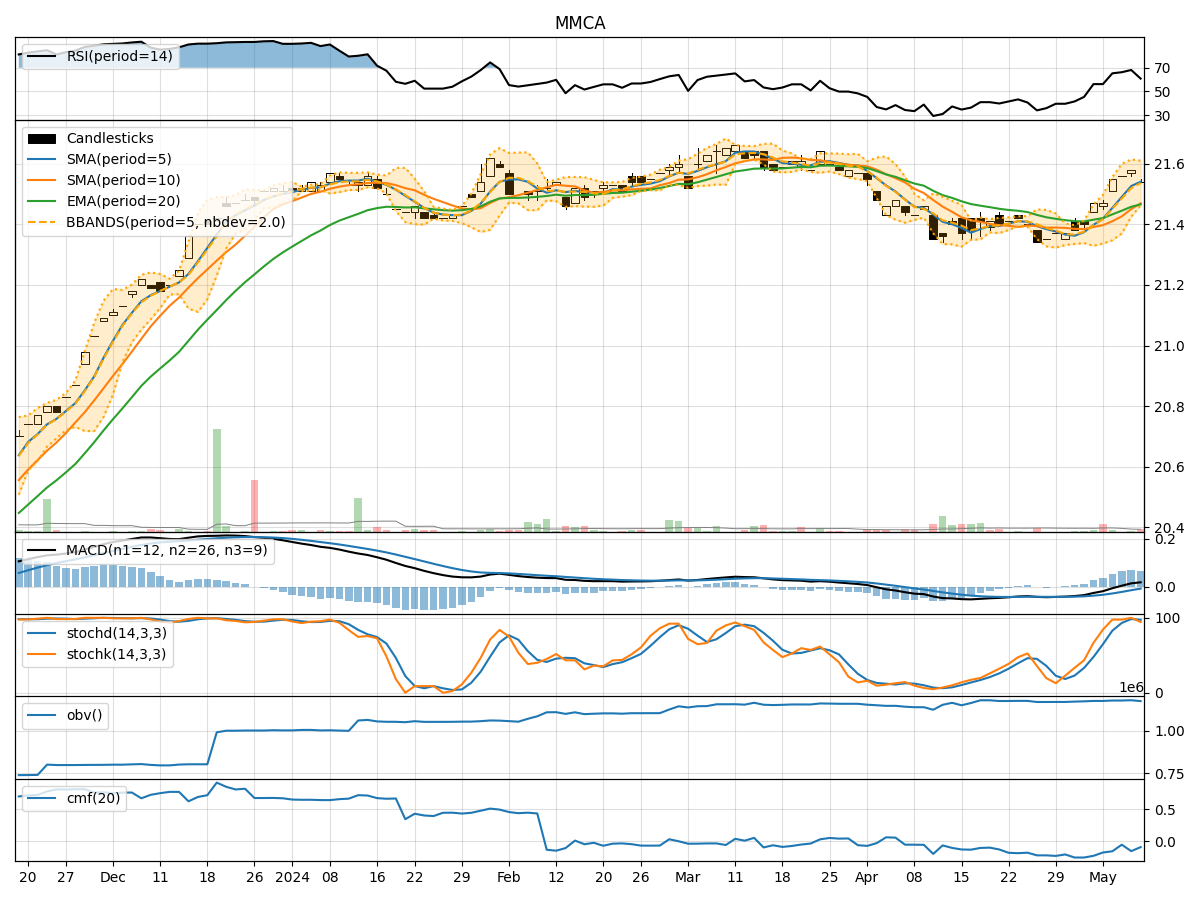
In analyzing the technical indicators for MMCA over the last 5 days, we will delve into the trend, momentum, volatility, and volume indicators to provide a comprehensive outlook on the possible stock price movement in the coming days. By examining these key aspects, we aim to offer valuable insights and recommendations for potential investors.
Trend Indicators:
- Moving Averages (MA): The 5-day MA has been consistently above the closing prices, indicating a short-term uptrend.
- MACD: The MACD line has been positive, suggesting bullish momentum.
- Relative Strength Index (RSI): The RSI has been fluctuating around the overbought territory, indicating strong buying pressure.
Momentum Indicators:
- Stochastic Oscillator: Both %K and %D have been in the overbought zone, signaling a potential reversal.
- Williams %R (WillR): The indicator has been in the oversold region, suggesting a possible buying opportunity.
Volatility Indicators:
- Bollinger Bands (BB): The bands have been relatively narrow, indicating low volatility.
- Bollinger %B (BBP): The %B has been hovering around 0.5, suggesting a balanced market sentiment.
Volume Indicators:
- On-Balance Volume (OBV): The OBV has shown a slight increase, indicating accumulation.
- Chaikin Money Flow (CMF): The CMF has been negative, suggesting some selling pressure.
Key Observations:
- The trend indicators point towards a bullish sentiment in the short term.
- Momentum indicators show conflicting signals with stochastic in overbought territory and Williams %R in oversold territory.
- Volatility indicators suggest a period of consolidation with low volatility.
- Volume indicators indicate a mixed sentiment with slight accumulation but negative CMF.
Conclusion:
Based on the analysis of the technical indicators, the next few days for MMCA stock price movement could see sideways consolidation with a slight upward bias. Investors should closely monitor the stochastic oscillator for a potential reversal and consider the low volatility environment indicated by the Bollinger Bands. It is advisable to exercise caution and wait for clearer signals before making significant trading decisions.