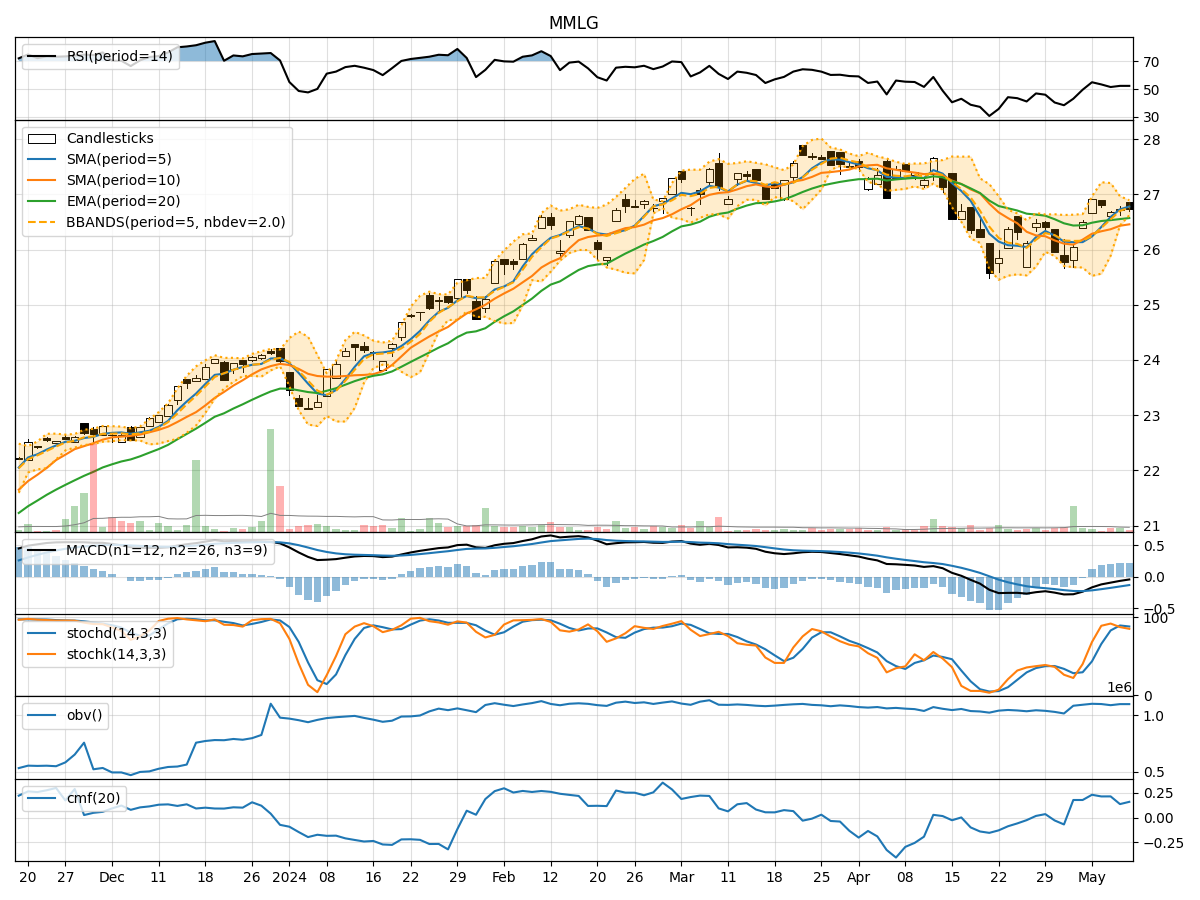
Technical Analysis of MMLG 2024-05-10
Overview:
In analyzing the technical indicators for MMLG stock over the last 5 days, we will delve into the trend, momentum, volatility, and volume indicators to provide a comprehensive outlook on the possible stock price movement in the coming days.
Trend Analysis:
- Moving Averages (MA): The 5-day MA has been consistently above the closing prices, indicating a short-term uptrend.
- MACD: The MACD line has been below the signal line but trending upwards, suggesting a potential bullish crossover.
- EMA: The EMA has been relatively flat, reflecting a lack of strong trend direction.
Momentum Analysis:
- RSI: The RSI has been hovering around the mid-level, indicating a neutral momentum.
- Stochastic Oscillator: Both %K and %D have been declining, signaling a potential bearish momentum.
- Williams %R: The indicator has been in oversold territory, suggesting a possible reversal.
Volatility Analysis:
- Bollinger Bands (BB): The bands have been narrowing, indicating decreasing volatility.
- BB %B: The %B has been relatively low, suggesting a potential consolidation phase.
Volume Analysis:
- On-Balance Volume (OBV): The OBV has shown mixed signals with alternating positive and negative values.
- Chaikin Money Flow (CMF): The CMF has been positive but declining, indicating weakening buying pressure.
Key Observations:
- The trend indicators suggest a mixed outlook with a slight bullish bias.
- Momentum indicators point towards a neutral to slightly bearish sentiment.
- Volatility indicators indicate decreasing volatility and a possible consolidation phase.
- Volume indicators show mixed signals with no clear direction.
Conclusion:
Based on the analysis of the technical indicators, the stock price of MMLG is likely to experience sideways movement in the coming days. The lack of strong trend direction, mixed momentum signals, decreasing volatility, and inconclusive volume patterns suggest a period of consolidation. Traders may expect the stock to trade within a narrow range without significant upward or downward movements. It is advisable to closely monitor key support and resistance levels for potential breakout opportunities.