Technical Analysis of MMSC 2024-05-10
Overview:
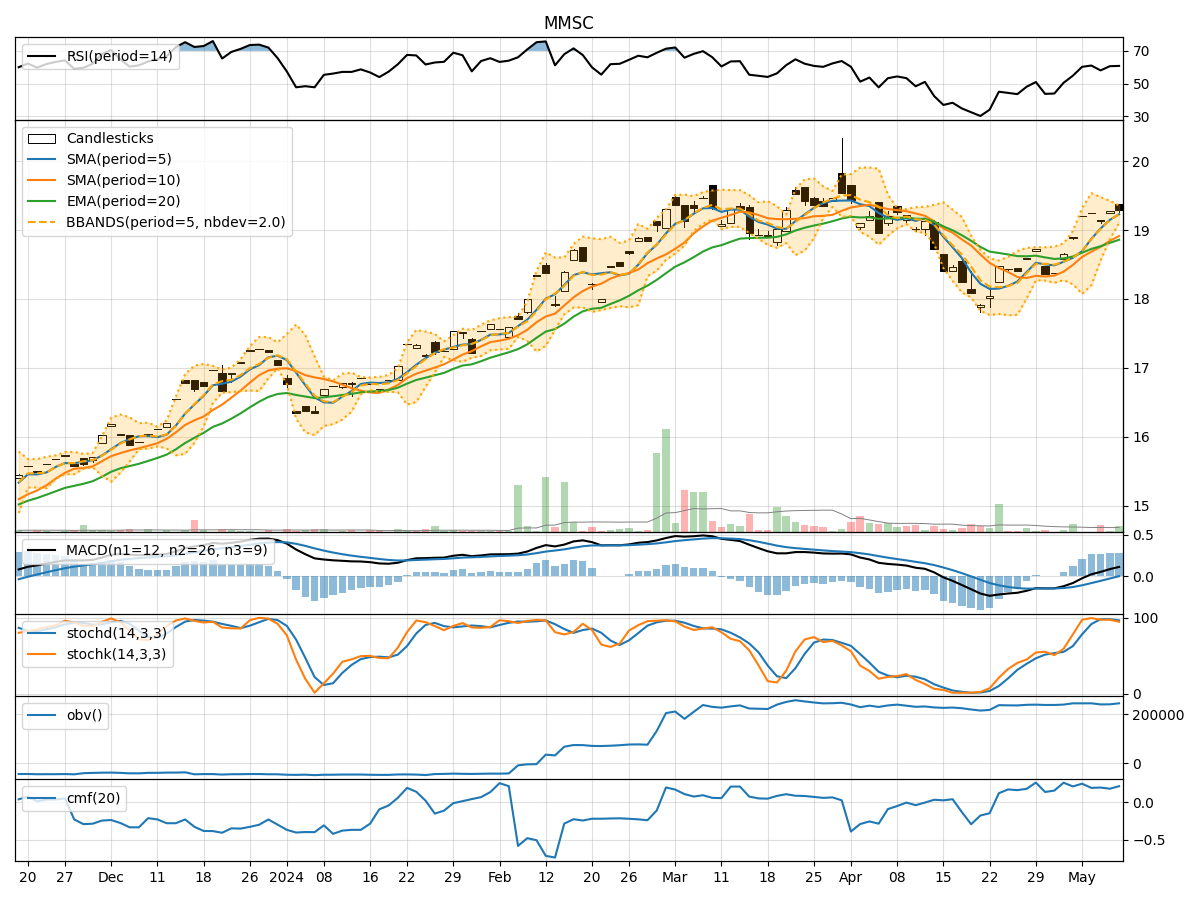
In the last 5 trading days, MMSC stock has shown a consistent uptrend in its price, with increasing volumes. The trend indicators suggest a positive momentum, supported by the moving averages and MACD. Momentum indicators like RSI and Stochastic oscillators indicate a slightly overbought condition but still within bullish territory. Volatility indicators show a narrowing Bollinger Bands, indicating potential consolidation. Volume indicators also reflect positive accumulation.
Trend Indicators Analysis:
- Moving Averages (MA): The 5-day MA has been consistently above the longer-term SMAs, indicating a short-term uptrend.
- MACD: The MACD line has been above the signal line, indicating bullish momentum.
- MACD Histogram: The histogram has been positive, showing increasing bullish momentum.
Momentum Indicators Analysis:
- RSI: The RSI has been in the overbought zone but has room for further upside before reaching extreme levels.
- Stochastic Oscillators: Both %K and %D have been high, suggesting strong buying pressure.
- Williams %R: The indicator is in the oversold region, indicating potential for a reversal.
Volatility Indicators Analysis:
- Bollinger Bands: The narrowing of the bands suggests decreasing volatility and a potential period of consolidation.
- Bollinger %B: The %B is above 0.5, indicating the price is closer to the upper band.
Volume Indicators Analysis:
- On-Balance Volume (OBV): The OBV has been steadily increasing, indicating strong buying interest.
- Chaikin Money Flow (CMF): The CMF is positive, showing that money is flowing into the stock.
Key Observations:
- The stock is in a strong uptrend supported by moving averages and MACD.
- Momentum indicators suggest a slightly overbought condition but still favorable for further upside.
- Volatility is decreasing, indicating a potential consolidation phase.
- Volume indicators confirm positive accumulation and buying interest.
Conclusion:
Based on the technical analysis of the indicators, the next few days for MMSC stock are likely to see continued upward movement. The stock is in a bullish phase, supported by strong trends, momentum, and volume accumulation. While there may be a brief consolidation period due to decreasing volatility, the overall outlook remains bullish. Traders and investors can consider buying on dips as the stock is expected to maintain its positive momentum.