Technical Analysis of MMTM 2024-05-10
Overview:
In analyzing the technical indicators for MMTM over the last 5 days, we will delve into the trend, momentum, volatility, and volume indicators to provide a comprehensive outlook on the possible stock price movement in the coming days. By examining these key factors, we aim to offer valuable insights and predictions to guide your investment decisions.
Trend Indicators:
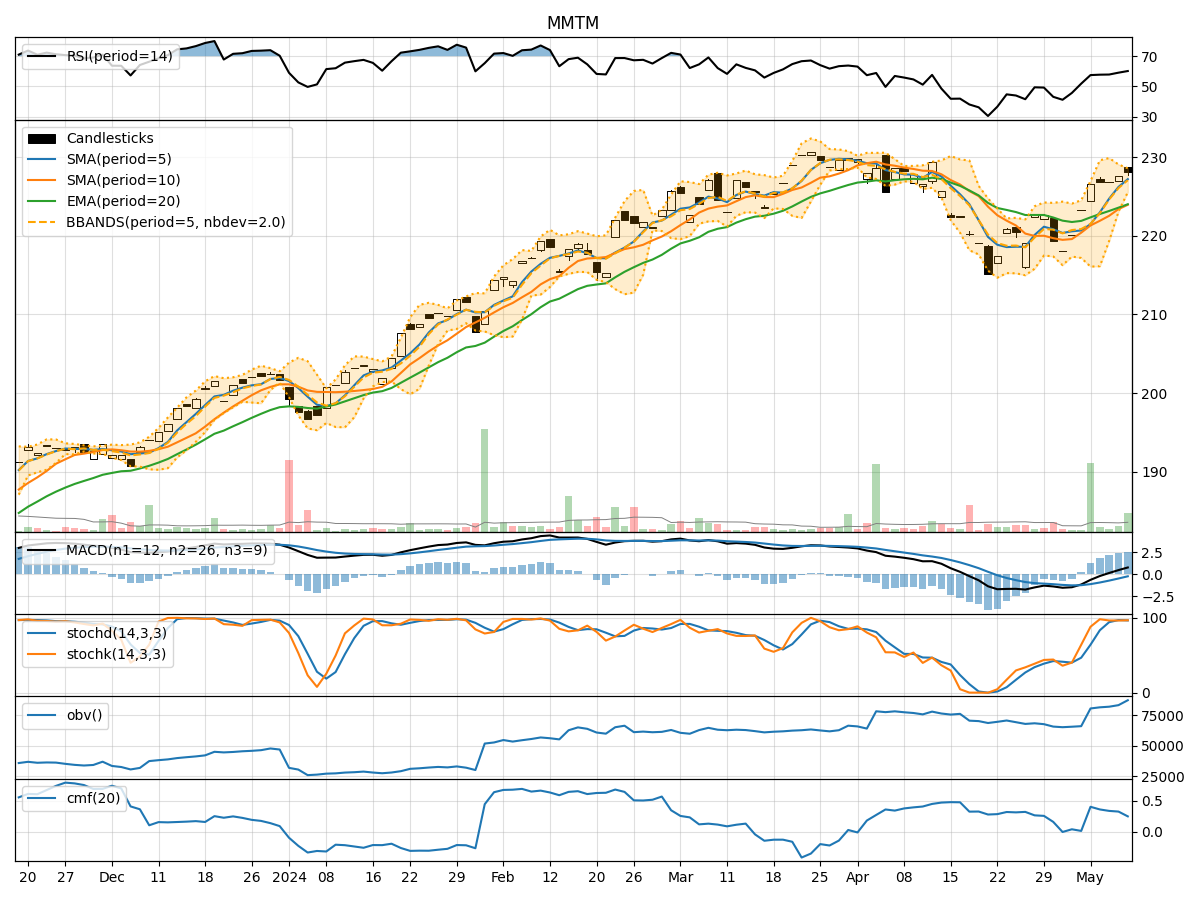
- Moving Averages (MA): The 5-day MA has been consistently above the 10-day SMA, indicating a short-term bullish trend. The EMA(20) has shown a gradual uptrend, suggesting positive momentum in the stock price.
- MACD: The MACD line has been above the signal line for the past 5 days, signaling a bullish trend. The MACD histogram has been increasing, indicating strengthening bullish momentum.
Momentum Indicators:
- RSI: The RSI has been gradually increasing and is currently in the overbought territory, suggesting a potential pullback or consolidation in the near future.
- Stochastic Oscillator: Both %K and %D lines of the Stochastic Oscillator have been in the overbought zone, indicating a potential reversal or correction.
Volatility Indicators:
- Bollinger Bands: The stock price has been trading within the upper Bollinger Band, indicating an overbought condition. The bands are relatively narrow, suggesting a period of low volatility.
- Bollinger %B: The %B indicator is above 0.8, indicating that the stock price is trading at the upper end of its recent price range.
Volume Indicators:
- On-Balance Volume (OBV): The OBV has been steadily increasing over the last 5 days, indicating strong buying pressure in the stock.
- Chaikin Money Flow (CMF): The CMF(20) has been positive but showing a slight decline, suggesting a potential decrease in buying pressure.
Key Observations and Opinions:
- Trend: The trend indicators suggest a strong bullish momentum in the stock price.
- Momentum: The momentum indicators indicate an overbought condition, signaling a potential reversal or consolidation.
- Volatility: The volatility indicators point towards a period of low volatility, potentially leading to a consolidation phase.
- Volume: The volume indicators show increasing buying pressure but a slight decline in buying momentum.
Conclusion:
Based on the analysis of the technical indicators, the stock price of MMTM is likely to experience a short-term consolidation or pullback in the coming days. The overbought conditions in the momentum indicators and the narrowing Bollinger Bands suggest a potential reversal in the bullish trend. Traders may consider taking profits or waiting for a better entry point before considering long positions.