Technical Analysis of MNA 2024-05-10
Overview:
In analyzing the technical indicators for MNA over the last 5 days, we will delve into the trend, momentum, volatility, and volume indicators to provide a comprehensive assessment of the stock's potential price movement. By examining these key factors, we aim to offer valuable insights and predictions for the next few days.
Trend Indicators:
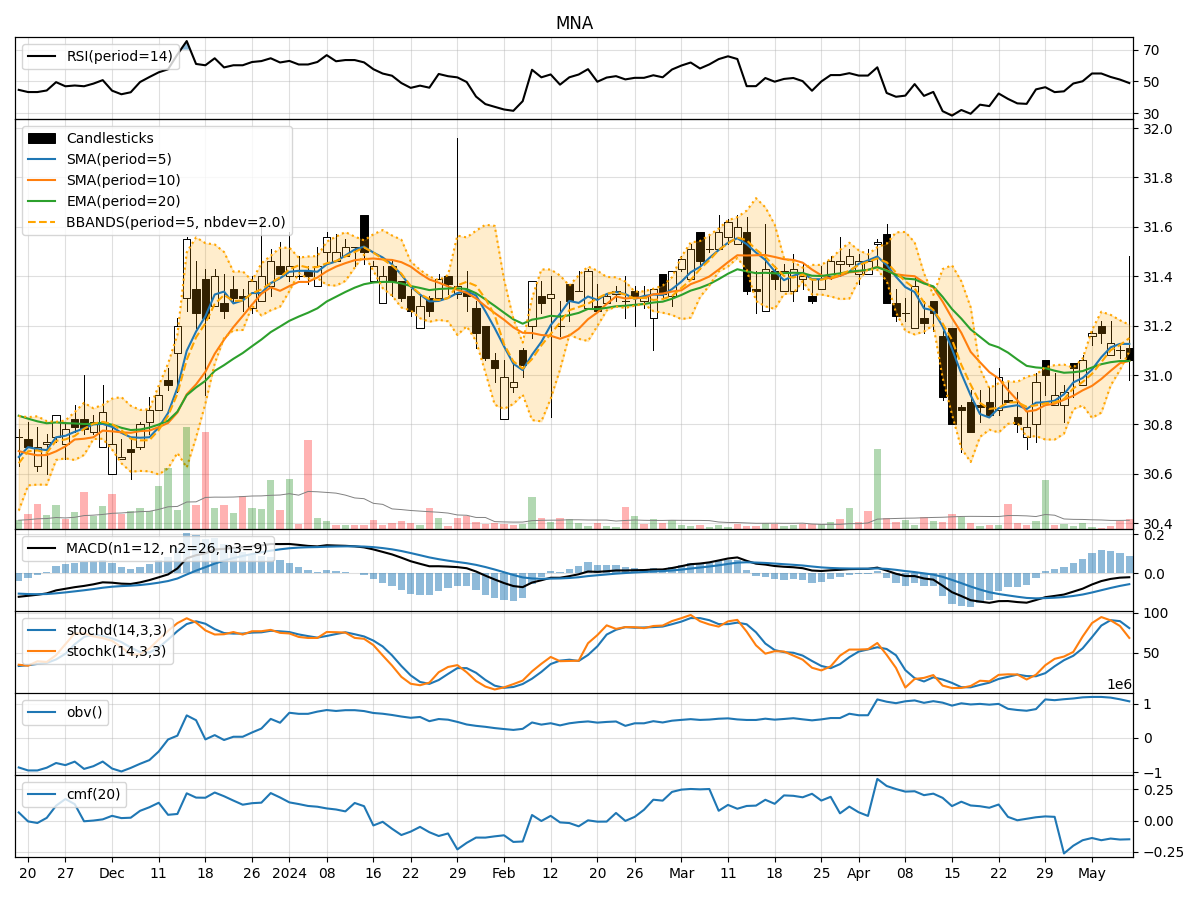
- Moving Averages (MA): The 5-day Moving Average (MA) has been consistently above the Simple Moving Average (SMA) and Exponential Moving Average (EMA), indicating a short-term bullish trend.
- MACD: The Moving Average Convergence Divergence (MACD) has been negative but showing signs of convergence, suggesting a potential reversal in the bearish trend.
- MACD Histogram: The MACD Histogram has been gradually decreasing, indicating a weakening bearish momentum.
Momentum Indicators:
- RSI: The Relative Strength Index (RSI) has been declining, moving towards the oversold territory, signaling a potential reversal or consolidation.
- Stochastic Oscillator: Both %K and %D have been decreasing, indicating a bearish momentum.
- Williams %R: The Williams %R is in the oversold region, suggesting a possible buying opportunity.
Volatility Indicators:
- Bollinger Bands: The Bollinger Bands have been narrowing, indicating decreasing volatility and a potential price breakout in the near future.
- Bollinger %B: The %B indicator is relatively low, suggesting a possible oversold condition.
Volume Indicators:
- On-Balance Volume (OBV): The OBV has been declining, indicating selling pressure and potential bearish sentiment.
- Chaikin Money Flow (CMF): The CMF has been negative, reflecting a lack of buying pressure and potential weakness in the stock.
Key Observations:
- The trend indicators suggest a short-term bullish bias, with signs of a potential trend reversal.
- Momentum indicators point towards a bearish momentum, but nearing oversold levels, indicating a possible reversal or consolidation.
- Volatility indicators show decreasing volatility, hinting at a potential price breakout.
- Volume indicators reflect selling pressure and a lack of buying interest in the stock.
Conclusion:
Based on the analysis of the technical indicators, the next few days for MNA could see sideways consolidation with a potential bullish bias. Traders should closely monitor the RSI for any signs of reversal, as well as the Bollinger Bands for a breakout confirmation. Additionally, keeping an eye on the OBV and CMF for any shifts in volume and money flow dynamics will be crucial in determining the stock's future price movement. Overall, a cautious approach with a bullish bias is recommended for the next few days.