Technical Analysis of MNBD 2024-05-10
Overview:
In analyzing the technical indicators for MNBD over the last 5 days, we will delve into the trend, momentum, volatility, and volume indicators to provide a comprehensive outlook on the possible stock price movement in the coming days. By examining these key aspects, we aim to offer valuable insights and predictions to guide your investment decisions.
Trend Indicators:
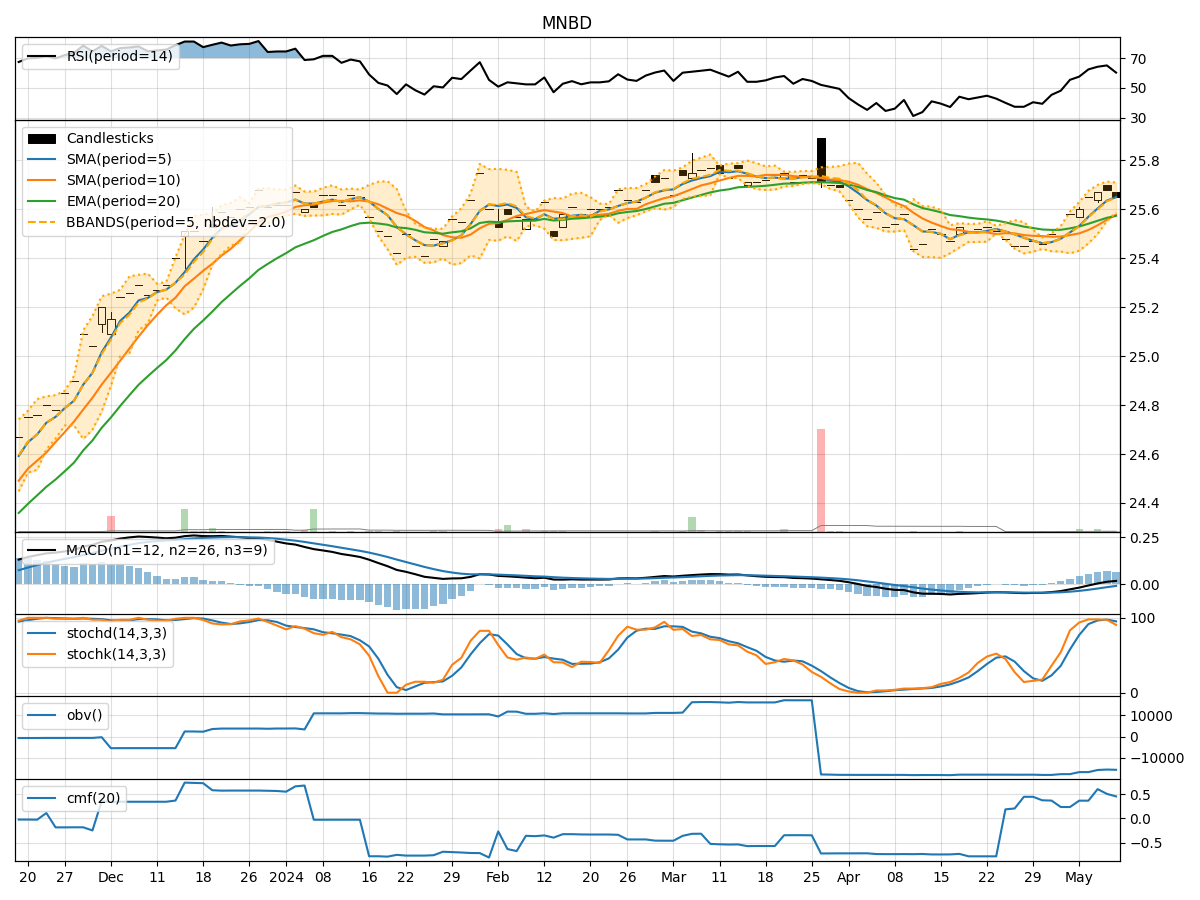
- Moving Averages (MA): The 5-day moving average has been consistently above the simple moving average (SMA) and exponential moving average (EMA), indicating a bullish trend.
- MACD: The MACD line has been consistently above the signal line, with both lines showing an upward trend, suggesting bullish momentum.
- MACD Histogram: The MACD histogram has been consistently above the zero line, indicating increasing bullish momentum.
Momentum Indicators:
- RSI: The Relative Strength Index (RSI) has been trending upwards but is not in overbought territory yet, suggesting potential room for further upside.
- Stochastic Oscillator: Both %K and %D lines of the Stochastic Oscillator have been in the overbought zone, indicating a strong bullish momentum.
- Williams %R: The Williams %R is in the oversold territory, suggesting a potential reversal or consolidation.
Volatility Indicators:
- Bollinger Bands: The stock price has been trading within the Bollinger Bands, with the bands narrowing, indicating decreasing volatility.
- Bollinger %B: The %B indicator is hovering around the midpoint, suggesting a balanced market sentiment.
Volume Indicators:
- On-Balance Volume (OBV): The OBV has been fluctuating but generally showing a slight decrease, indicating some distribution.
- Chaikin Money Flow (CMF): The CMF has been positive, indicating buying pressure in the market.
Key Observations and Opinions:
- Trend: The trend indicators suggest a strong bullish sentiment in the stock.
- Momentum: Momentum indicators indicate a strong bullish momentum, but some indicators are approaching overbought levels.
- Volatility: Volatility has been decreasing, potentially signaling a period of consolidation.
- Volume: Volume indicators show mixed signals, with OBV slightly decreasing but CMF remaining positive.
Conclusion:
Based on the analysis of the technical indicators, the next few days' possible stock price movement for MNBD is likely to be upward with a potential for further bullish momentum. However, caution is advised as some momentum indicators are approaching overbought levels, suggesting a possible pullback or consolidation in the short term. Traders and investors should closely monitor key support and resistance levels to make informed decisions.