Technical Analysis of MNTL 2024-05-10
Overview:
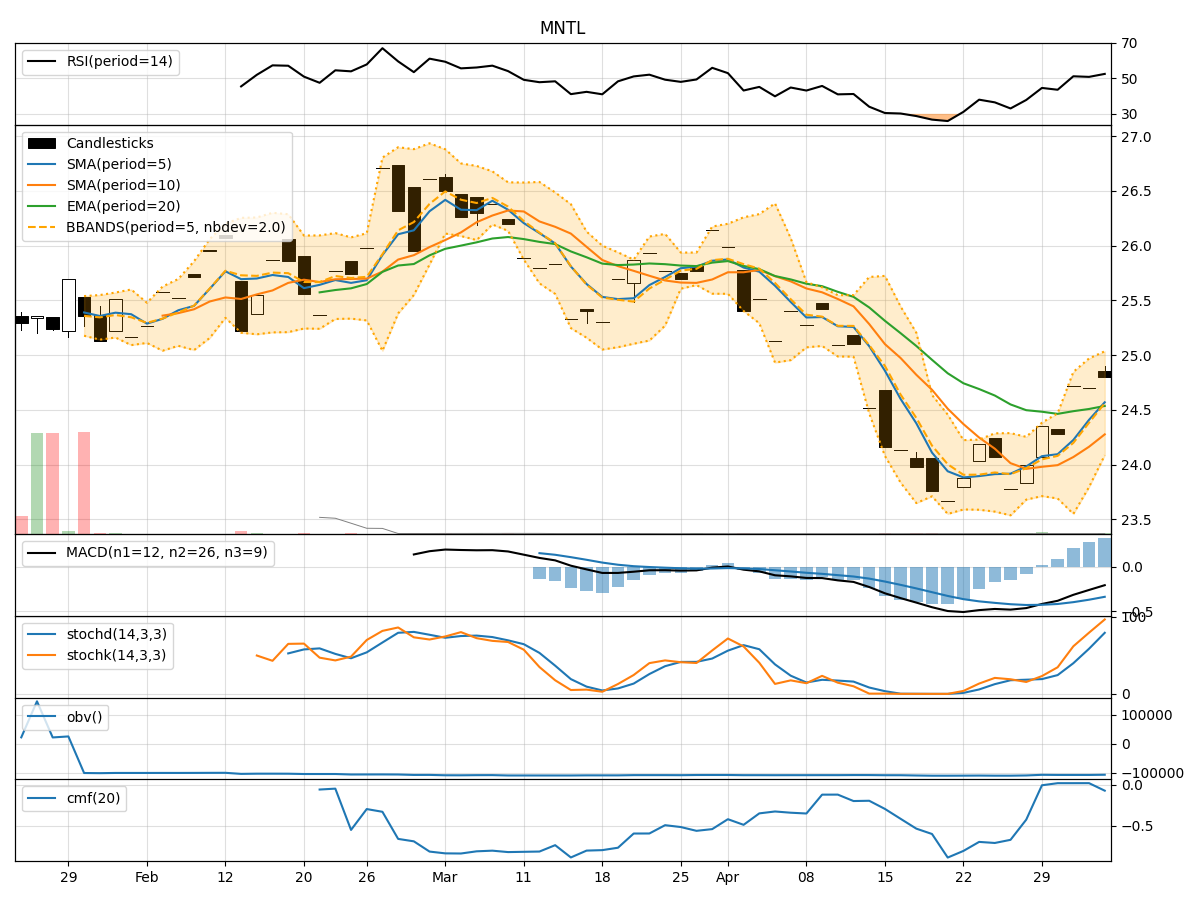
In analyzing the technical indicators for MNTL over the last 5 days, we will delve into the trend, momentum, volatility, and volume indicators to provide a comprehensive outlook on the possible stock price movement in the coming days. By examining these key aspects, we aim to offer valuable insights and predictions to guide investment decisions.
Trend Indicators:
- Moving Averages (MA): The 5-day MA has been consistently above the 10-day SMA, indicating a short-term bullish trend. The EMA(20) has shown a slight upward trend, suggesting positive momentum.
- MACD: The MACD line has been below the signal line, indicating a bearish signal. However, the MACD histogram has been gradually decreasing, hinting at a potential reversal.
- Conclusion: The trend indicators suggest a mixed outlook with a slight bullish bias in the short term.
Momentum Indicators:
- RSI: The RSI has been fluctuating around the neutral level of 50, indicating indecision in the market.
- Stochastic Oscillator: Both %K and %D have been declining, signaling a potential bearish momentum.
- Williams %R: The indicator has been in oversold territory, suggesting a possible reversal.
- Conclusion: Momentum indicators point towards a bearish sentiment in the near future.
Volatility Indicators:
- Bollinger Bands: The stock price has been trading within the bands, indicating normal volatility levels.
- Conclusion: Volatility indicators suggest a stable price movement with no significant deviations expected.
Volume Indicators:
- On-Balance Volume (OBV): The OBV has been fluctuating, indicating mixed buying and selling pressure.
- Chaikin Money Flow (CMF): The CMF has shown a slight positive trend, suggesting some accumulation.
- Conclusion: Volume indicators reflect mixed sentiment with no clear direction.
Overall Conclusion:
Based on the analysis of trend, momentum, volatility, and volume indicators, the overall outlook for MNTL in the next few days leans towards a bearish bias. While the trend indicators show a slight bullish inclination, momentum indicators signal a bearish sentiment. Volatility indicators suggest stability, and volume indicators indicate mixed sentiment.
Recommendation:
Considering the comprehensive analysis of technical indicators, it is advisable to exercise caution in trading MNTL in the coming days. Traders may consider short-term bearish strategies or wait for more clarity in market direction before making significant investment decisions. Monitoring key support and resistance levels along with market developments is crucial for informed decision-making.
Disclaimer:
This analysis is based solely on technical indicators and does not take into account fundamental factors or external market influences. It is essential to conduct thorough research and consider multiple sources of information before making any investment decisions. Consulting with a financial advisor is recommended to tailor strategies to individual risk tolerance and investment goals.