Technical Analysis of MOAT 2024-05-10
Overview:
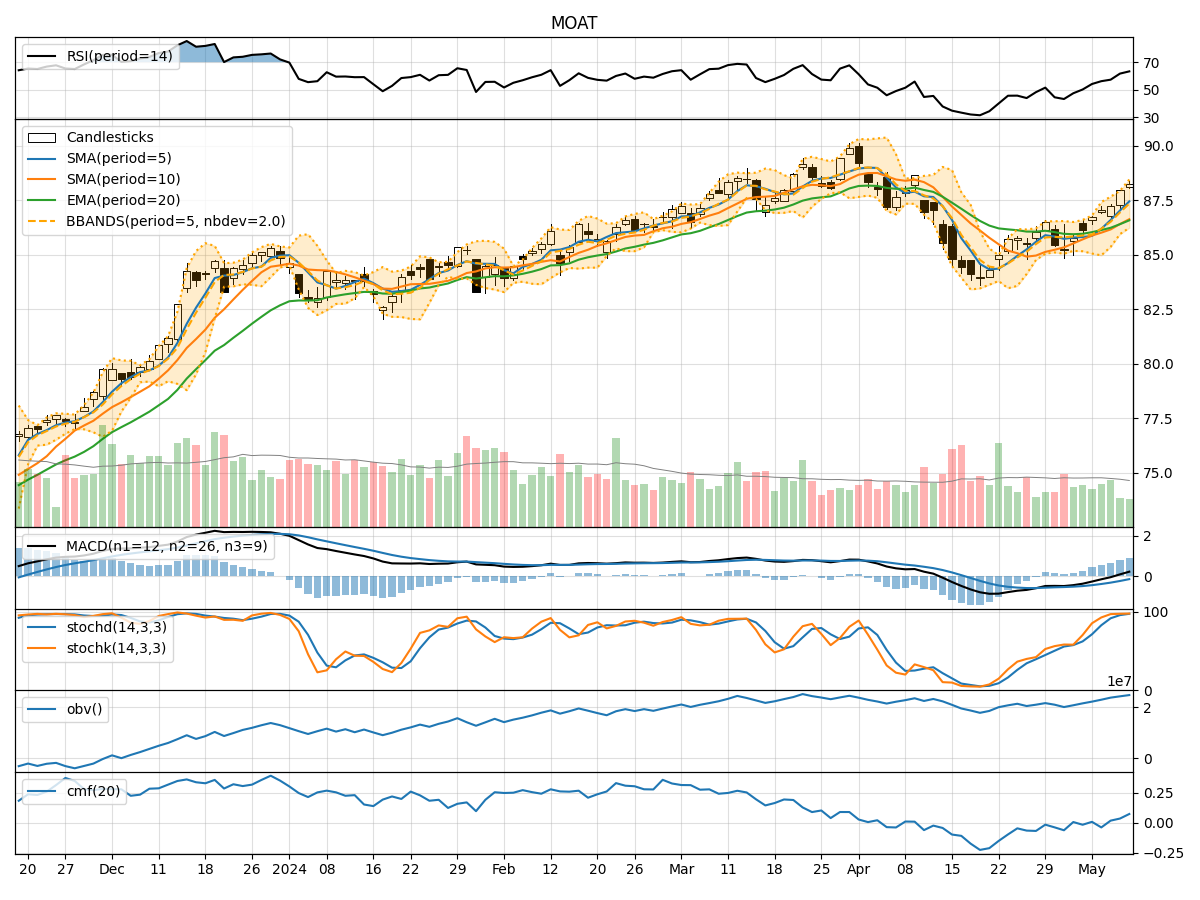
In analyzing the technical indicators for MOAT over the last 5 days, we will delve into the trend, momentum, volatility, and volume indicators to provide a comprehensive assessment of the stock's potential price movement. By examining these key factors, we aim to offer valuable insights and predictions for the upcoming days.
Trend Analysis:
- Moving Averages (MA): The 5-day MA has been consistently above the closing prices, indicating a bullish trend.
- MACD: The MACD line has been above the signal line, suggesting a bullish momentum.
- RSI: The RSI has been trending upwards, indicating increasing buying pressure.
Key Observation: The trend indicators point towards a bullish sentiment in the stock price movement.
Momentum Analysis:
- Stochastic Oscillator: Both %K and %D have been in the overbought zone, signaling a potential reversal.
- Williams %R: The indicator has been in the oversold territory, suggesting a possible buying opportunity.
Key Observation: Momentum indicators show a mixed signal with potential for a short-term correction.
Volatility Analysis:
- Bollinger Bands: The stock price has been trading within the bands, indicating moderate volatility.
- Bollinger %B: The %B indicator has been fluctuating around the midline, suggesting a balanced market sentiment.
Key Observation: Volatility indicators suggest a sideways movement in the stock price.
Volume Analysis:
- On-Balance Volume (OBV): The OBV has been trending upwards, indicating accumulation by investors.
- Chaikin Money Flow (CMF): The CMF has been positive, reflecting buying pressure.
Key Observation: Volume indicators support a bullish outlook for the stock.
Conclusion:
Based on the analysis of trend, momentum, volatility, and volume indicators, the overall outlook for MOAT in the next few days is bullish with a potential for a short-term correction due to overbought conditions in momentum indicators. The stock is likely to experience moderate volatility while maintaining an upward bias supported by increasing buying pressure and positive volume accumulation. Traders may consider entering long positions with caution, keeping an eye on potential pullbacks for better entry points.
Key Conclusion: The stock is expected to continue its upward trajectory with intermittent corrections, presenting opportunities for bullish trades.