Technical Analysis of MOHR 2024-05-10
Overview:
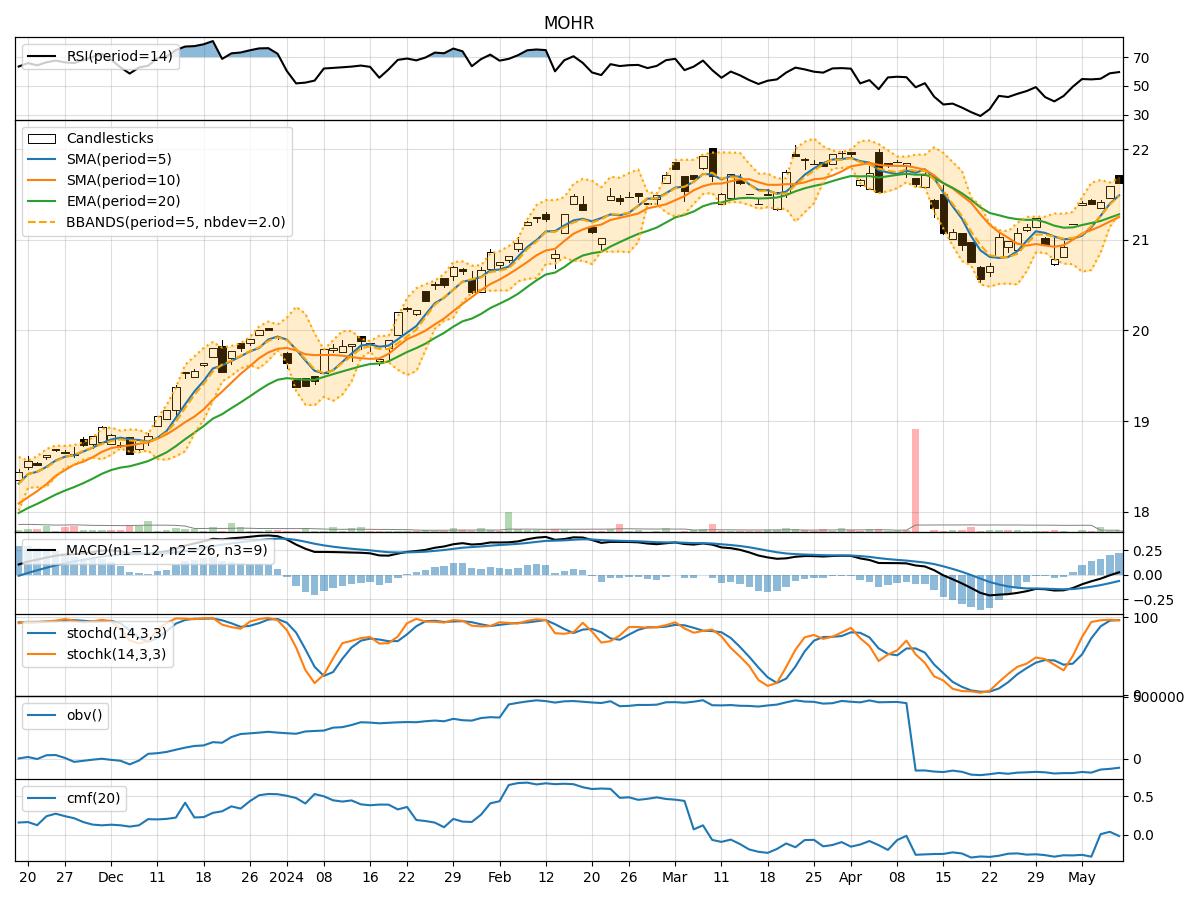
In analyzing the technical indicators for MOHR stock over the last 5 days, we will delve into the trend, momentum, volatility, and volume indicators to provide a comprehensive outlook on the possible stock price movement in the coming days.
Trend Indicators:
- Moving Averages (MA): The 5-day Moving Average has been consistently above the Simple Moving Average (SMA) and Exponential Moving Average (EMA), indicating a short-term uptrend.
- MACD: The Moving Average Convergence Divergence (MACD) has been negative but showing signs of convergence towards the signal line, suggesting a potential reversal in the trend.
- MACD Histogram: The MACD Histogram has been decreasing but is approaching the zero line, indicating a possible shift in momentum.
Momentum Indicators:
- RSI: The Relative Strength Index (RSI) has been in the neutral zone around 50, indicating a balanced momentum.
- Stochastic Oscillator: Both %K and %D have been in the overbought territory, suggesting a potential reversal or consolidation.
- Williams %R: The Williams %R is in the oversold region, indicating a possible buying opportunity.
Volatility Indicators:
- Bollinger Bands: The stock price has been trading within the Bollinger Bands, with the bands narrowing, indicating reduced volatility.
- Bollinger %B: The %B indicator has been fluctuating around 0.8, suggesting a moderate level of volatility.
Volume Indicators:
- On-Balance Volume (OBV): The OBV has been declining, indicating selling pressure in the stock.
- Chaikin Money Flow (CMF): The CMF has been negative, reflecting a lack of buying interest.
Key Observations and Opinions:
- Trend: The stock is in a short-term uptrend based on moving averages, but the MACD signals a potential reversal.
- Momentum: Momentum indicators are mixed, with RSI neutral, Stochastic overbought, and Williams %R oversold, indicating a lack of clear direction.
- Volatility: Volatility has been decreasing, suggesting a period of consolidation or a potential breakout.
- Volume: The declining OBV and negative CMF indicate bearish sentiment and lack of strong buying interest.
Conclusion:
Based on the analysis of the technical indicators, the stock is likely to experience sideways movement in the coming days with a potential for a slight downward bias. Traders should exercise caution and wait for clearer signals before making significant trading decisions.