Technical Analysis of MOON 2024-05-10
Overview:
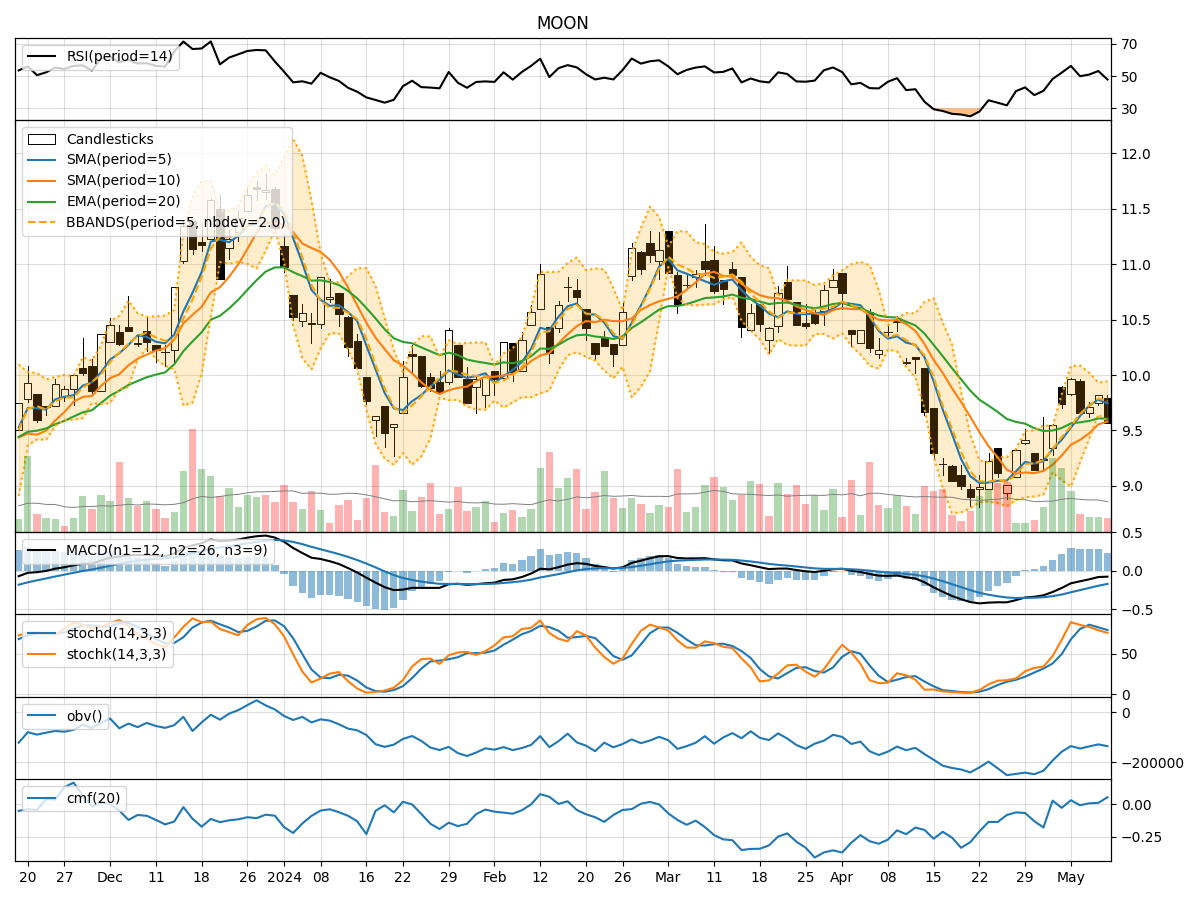
In analyzing the technical indicators for the stock MOON over the last 5 days, we will delve into the trends, momentum, volatility, and volume indicators to provide a comprehensive outlook on the possible stock price movement in the coming days.
Trend Analysis:
- Moving Averages (MA): The 5-day Moving Average (MA) has been consistently above the Simple Moving Average (SMA) and Exponential Moving Average (EMA), indicating a short-term uptrend.
- MACD: The MACD line has been below the signal line, suggesting a bearish momentum in the stock price.
- MACD Histogram: The MACD Histogram has been decreasing, indicating a weakening bearish momentum.
Momentum Analysis:
- RSI: The Relative Strength Index (RSI) has been fluctuating around the 50 level, indicating a neutral momentum.
- Stochastic Oscillator: Both %K and %D have been declining, signaling a bearish momentum.
- Williams %R: The Williams %R is in the oversold territory, suggesting a potential reversal.
Volatility Analysis:
- Bollinger Bands (BB): The stock price has been trading within the Bollinger Bands, with the bands narrowing, indicating decreasing volatility.
- Bollinger %B: The %B indicator is hovering around the midline, suggesting a balanced market sentiment.
Volume Analysis:
- On-Balance Volume (OBV): The OBV has shown mixed signals, with fluctuations in volume accumulation.
- Chaikin Money Flow (CMF): The CMF has been positive, indicating buying pressure in the stock.
Key Observations:
- The stock is currently in a short-term uptrend based on moving averages.
- Momentum indicators suggest a bearish bias, with the potential for a reversal indicated by the oversold Williams %R.
- Volatility has been decreasing, indicating a possible period of consolidation.
- Volume indicators show mixed signals, with some buying pressure indicated by the CMF.
Conclusion:
Based on the analysis of the technical indicators, the stock price of MOON is likely to experience sideways movement or consolidation in the coming days. The short-term uptrend indicated by moving averages may face resistance due to the bearish momentum highlighted by the MACD and Stochastic Oscillator. However, the oversold condition suggested by the Williams %R could lead to a potential reversal. Overall, the stock is expected to trade within a range with limited volatility, influenced by mixed volume signals. Caution is advised for traders, and it is recommended to closely monitor key support and resistance levels for potential trading opportunities.