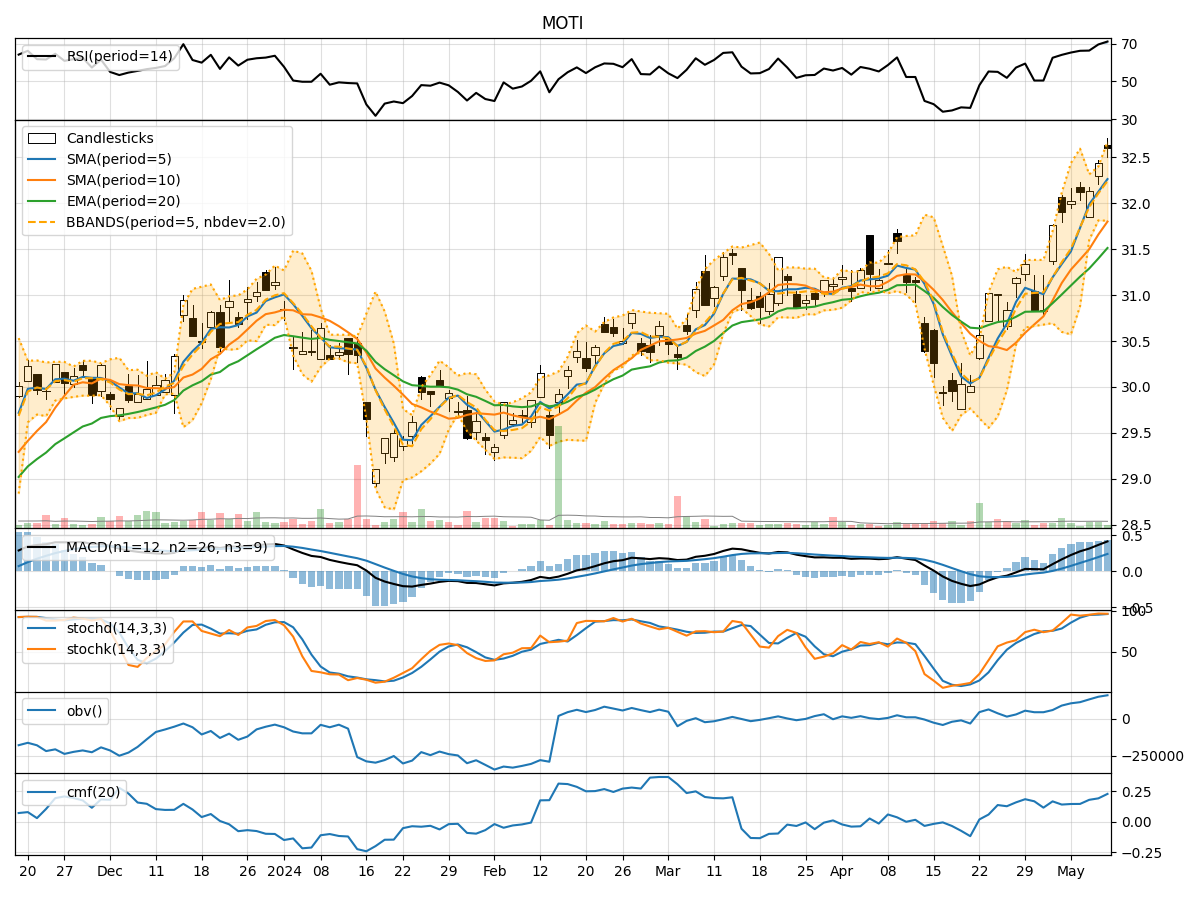
Technical Analysis of MOTI 2024-05-10
Overview:
In analyzing the technical indicators for MOTI over the last 5 days, we will delve into the trend, momentum, volatility, and volume indicators to provide a comprehensive outlook on the possible stock price movement in the coming days. By examining these key indicators, we aim to offer valuable insights and recommendations for potential investors.
Trend Analysis:
- Moving Averages (MA): The 5-day Moving Average has been consistently rising, indicating a bullish trend in the short term.
- MACD: The MACD line has been above the signal line, suggesting positive momentum in the stock price.
- EMA: The Exponential Moving Average has also been trending upwards, supporting the bullish sentiment.
Momentum Analysis:
- RSI: The Relative Strength Index has been increasing, showing strengthening momentum.
- Stochastic Oscillator: Both %K and %D have been in the overbought zone, indicating a potential reversal or consolidation.
- Williams %R: The indicator has been fluctuating around oversold levels, suggesting a mixed sentiment.
Volatility Analysis:
- Bollinger Bands: The stock price has been trading within the bands, indicating moderate volatility.
- Bollinger %B: The %B indicator has been fluctuating around the midline, reflecting a neutral stance on volatility.
Volume Analysis:
- On-Balance Volume (OBV): The OBV has been steadily increasing, signaling accumulation by investors.
- Chaikin Money Flow (CMF): The CMF has been positive, indicating buying pressure in the stock.
Key Observations:
- The trend indicators suggest a bullish sentiment in the short term.
- Momentum indicators show mixed signals with potential for a reversal or consolidation.
- Volatility remains moderate, with no extreme fluctuations observed.
- Volume indicators point towards accumulation and positive buying pressure.
Conclusion:
Based on the analysis of the technical indicators, the stock price of MOTI is likely to experience further upward movement in the coming days. The bullish trend supported by moving averages and MACD, coupled with positive momentum indicated by RSI and OBV, suggests a favorable outlook for investors. While some caution is advised due to overbought levels in the stochastic oscillator, the overall picture remains bullish. Traders may consider buying opportunities on pullbacks for potential gains.