Technical Analysis of MOTO 2024-05-10
Overview:
In analyzing the technical indicators for MOTO stock over the last 5 days, we will delve into the trend, momentum, volatility, and volume indicators to provide a comprehensive outlook on the possible stock price movement in the coming days. By examining these key indicators, we aim to offer valuable insights and predictions for potential investors.
Trend Analysis:
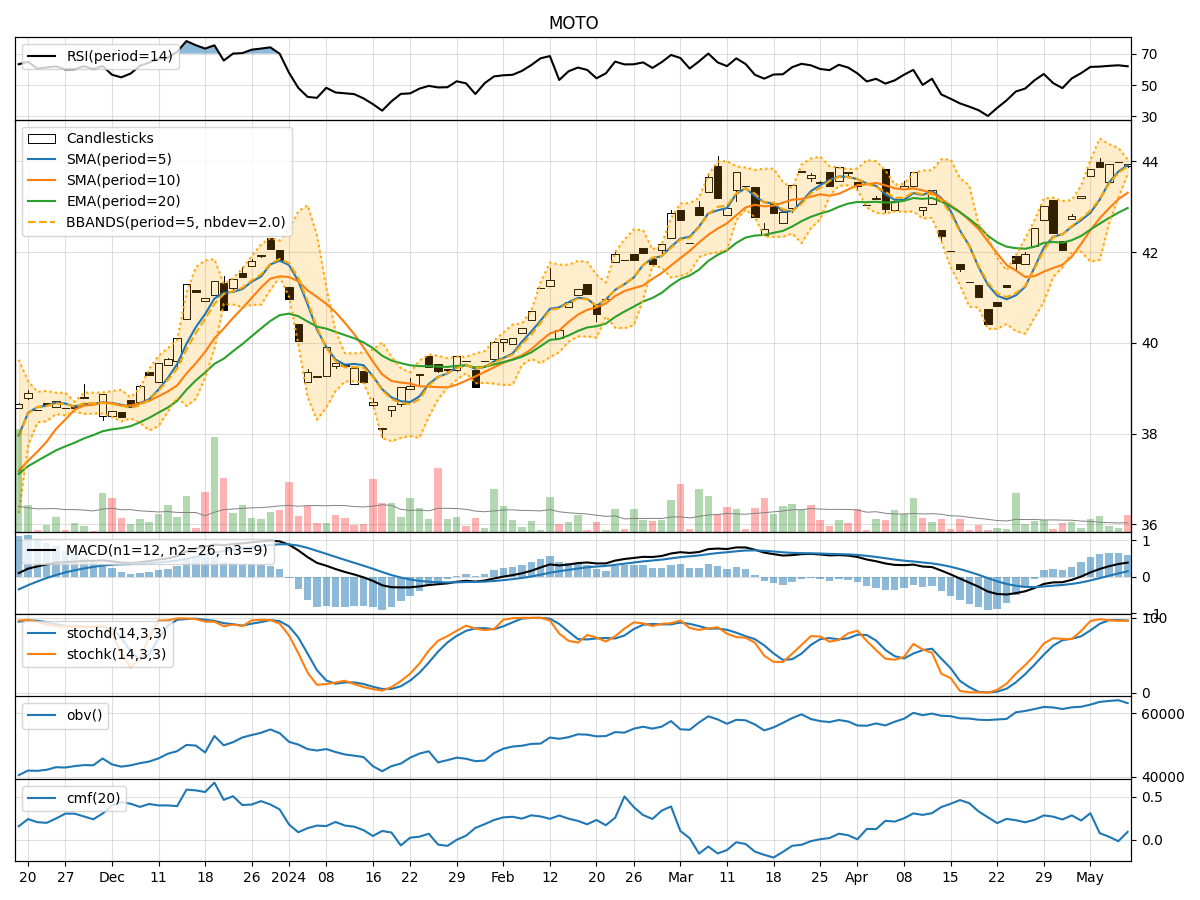
- Moving Averages (MA): The 5-day moving average has been consistently above the simple moving average (SMA) of 10 days, indicating a short-term bullish trend.
- Exponential Moving Average (EMA): The EMA has been steadily increasing, reflecting a positive momentum in the stock price.
- Moving Average Convergence Divergence (MACD): The MACD line has been above the signal line, suggesting a bullish trend.
- Conclusion: The trend indicators point towards an upward movement in the stock price.
Momentum Analysis:
- Relative Strength Index (RSI): The RSI has been in the range of 60-65, indicating a moderate level of buying pressure.
- Stochastic Oscillator (Stoch): Both %K and %D have been hovering around 95-98, signaling an overbought condition.
- Williams %R (WillR): The Williams %R is negative, suggesting a potential reversal in the short term.
- Conclusion: The momentum indicators suggest a potential pullback or consolidation in the stock price.
Volatility Analysis:
- Bollinger Bands (BB): The stock price has been trading within the upper and lower bands, indicating moderate volatility.
- Bollinger Band Width (BBW): The BBW has been narrowing, suggesting a decrease in volatility.
- Conclusion: Volatility is decreasing, which may lead to a period of consolidation or a breakout in the stock price.
Volume Analysis:
- On-Balance Volume (OBV): The OBV has shown a slight increase, indicating a positive volume flow.
- Chaikin Money Flow (CMF): The CMF has been positive, reflecting buying pressure in the stock.
- Conclusion: Volume indicators suggest positive accumulation in the stock, supporting the bullish trend.
Overall Conclusion:
Based on the analysis of trend, momentum, volatility, and volume indicators, the next few days' possible stock price movement for MOTO is likely to be upward with a potential for a short-term pullback or consolidation due to overbought conditions in the momentum indicators. The decreasing volatility may lead to a period of sideways movement before a potential breakout. Investors should consider entering long positions with caution and monitor the stock closely for any signs of reversal or continuation of the current trend.