Technical Analysis of MRAD 2024-05-10
Overview:
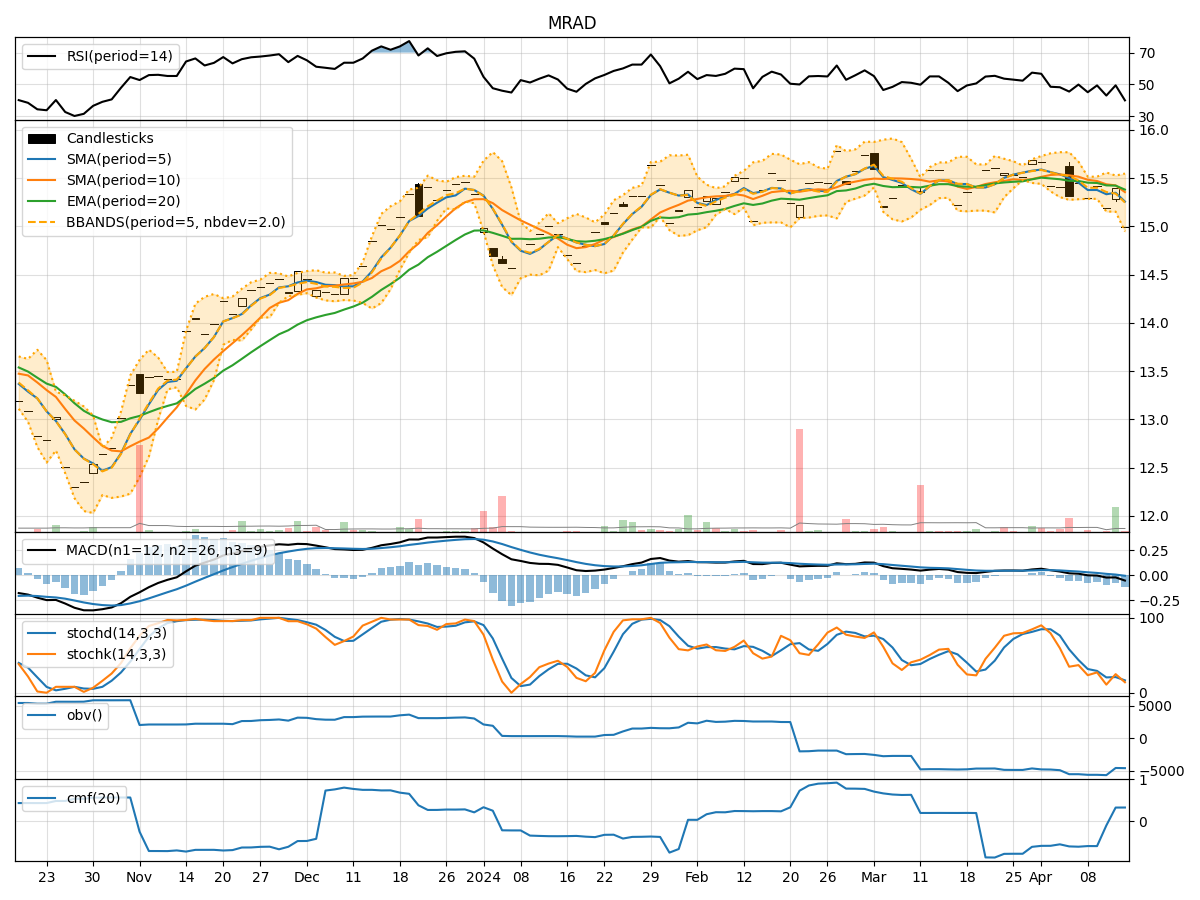
In analyzing the technical indicators for MRAD over the last 5 days, we will delve into the trend, momentum, volatility, and volume indicators to provide a comprehensive outlook on the possible stock price movement in the coming days. By examining these key indicators, we aim to offer valuable insights and predictions for potential investors.
Trend Analysis:
- Moving Averages (MA): The 5-day Moving Average (MA) has been fluctuating around the actual closing prices, indicating a lack of clear trend direction.
- MACD and Signal Line: The MACD has been consistently negative, suggesting a bearish momentum in the short term.
- Relative Strength Index (RSI): The RSI has been hovering around the neutral zone, indicating a lack of strong buying or selling pressure.
Key Observation: The trend indicators suggest a neutral to slightly bearish sentiment in the short term.
Momentum Analysis:
- Stochastic Oscillator: The Stochastic Oscillator has been declining, indicating a weakening momentum.
- Williams %R (Willr): The Williams %R has been in the oversold territory, signaling a potential reversal or consolidation.
Key Observation: Momentum indicators point towards a bearish bias with a possibility of a reversal or consolidation in the near future.
Volatility Analysis:
- Bollinger Bands (BB): The Bollinger Bands have been narrowing, suggesting decreasing volatility in the stock price.
- Bollinger %B (BBP): The %B indicator is approaching the lower band, indicating a potential oversold condition.
Key Observation: Volatility indicators signal a decrease in volatility and a possible oversold condition, which could lead to a reversal.
Volume Analysis:
- On-Balance Volume (OBV): The OBV has been slightly declining, indicating a decrease in buying pressure.
- Chaikin Money Flow (CMF): The CMF has been negative, suggesting a bearish money flow trend.
Key Observation: Volume indicators reflect a bearish sentiment with decreasing buying pressure and negative money flow.
Conclusion:
Based on the analysis of trend, momentum, volatility, and volume indicators, the overall outlook for MRAD in the next few days is bearish. The trend indicators show a lack of clear direction, while momentum indicators suggest a weakening momentum with a potential for reversal or consolidation. Volatility indicators point towards decreasing volatility and a possible oversold condition, which could lead to a reversal. Volume indicators indicate a bearish sentiment with decreasing buying pressure.
In conclusion, the next few days for MRAD are likely to see a downward movement with a possibility of consolidation or reversal in the near future. Investors should exercise caution and consider waiting for more definitive signals before making any trading decisions.