Technical Analysis of MRCP 2024-05-10
Overview:
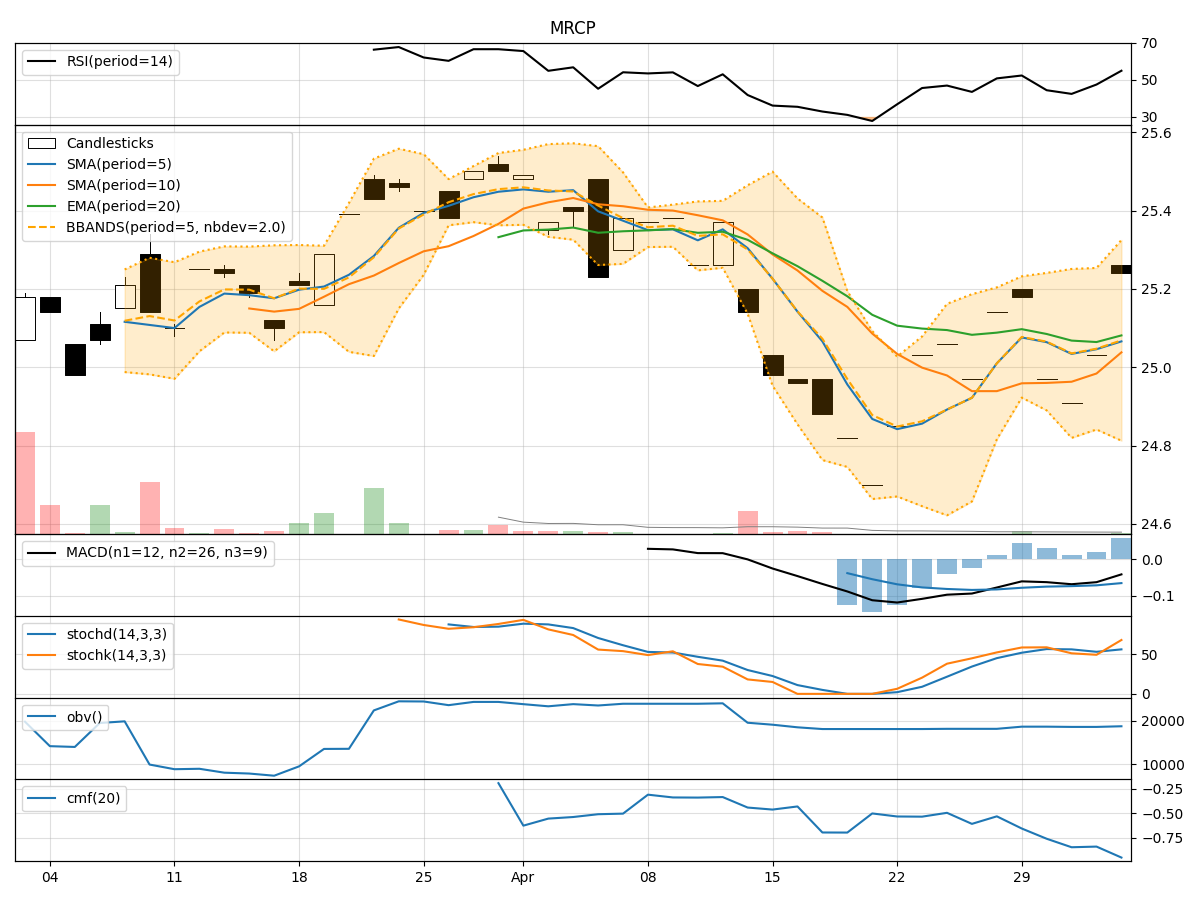
In the last 5 trading days, MRCP stock has shown a consistent uptrend in its price, with incremental increases each day. The trend indicators such as Moving Averages (MA), MACD, and RSI suggest a positive momentum in the stock. Volatility indicators like Bollinger Bands (BB) and Volume indicators also provide insights into the stock's behavior. Let's delve deeper into each category of indicators to provide a comprehensive analysis and make a prediction for the next few days.
Trend Indicators:
- Moving Averages (MA): The 5-day MA has been consistently above the closing price, indicating a bullish trend.
- MACD: The MACD line has been consistently above the signal line, suggesting a bullish momentum.
- RSI: The RSI has been increasing, indicating strengthening buying pressure.
Key Observation: The trend indicators all point towards a bullish trend in the stock price.
Momentum Indicators:
- Stochastic Oscillator: Both %K and %D have been at 100%, indicating strong positive momentum.
- Williams %R: The indicator is at 0, suggesting the stock is in overbought territory.
Key Observation: Momentum indicators signal a strong bullish momentum in the stock.
Volatility Indicators:
- Bollinger Bands (BB): The bands have been narrowing, indicating decreasing volatility.
- Bollinger %B: The %B is above 0.8, suggesting the stock is trading near the upper band.
Key Observation: Volatility indicators suggest a period of low volatility and the stock nearing overbought levels.
Volume Indicators:
- On-Balance Volume (OBV): The OBV has remained constant, indicating stable buying pressure.
- Chaikin Money Flow (CMF): The CMF is negative, suggesting a slight outflow of money from the stock.
Key Observation: Volume indicators show a neutral stance with a slight outflow of money.
Conclusion:
Based on the analysis of the technical indicators, the next few days' possible stock price movement for MRCP is likely to continue its upward trajectory. The bullish trend, strong momentum, and low volatility indicate a positive outlook for the stock. However, caution should be exercised as the stock is in overbought territory according to the Williams %R indicator. Traders and investors should closely monitor the price action and consider taking profits if the stock reaches extreme overbought levels.
Overall View: Bullish with a note of caution on overbought levels.