Technical Analysis of MRGR 2024-05-10
Overview:
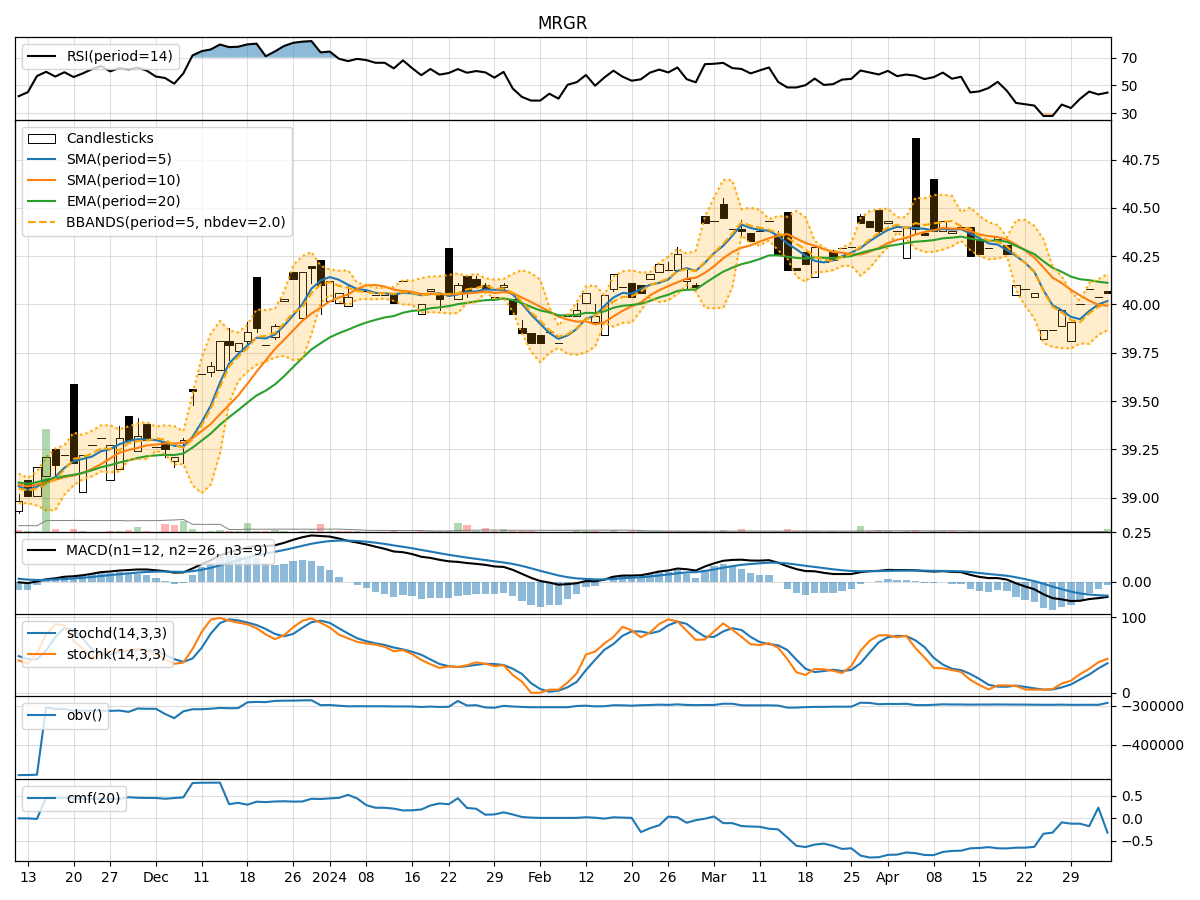
In analyzing the technical indicators for MRGR over the last 5 days, we will delve into the trend, momentum, volatility, and volume indicators to provide a comprehensive outlook on the possible stock price movement in the coming days.
Trend Indicators:
- Moving Averages (MA): The 5-day MA has been fluctuating around the $40 mark, indicating a relatively stable price trend.
- MACD: The MACD line has been consistently below the signal line, suggesting a bearish momentum in the short term.
- EMA: The EMA has been gradually declining, reflecting a downward trend in the stock price.
Momentum Indicators:
- RSI: The RSI has been fluctuating around the mid-range, indicating a lack of strong momentum in either direction.
- Stochastic Oscillator: The stochastic indicators have shown mixed signals, with no clear indication of overbought or oversold conditions.
- Williams %R: The Williams %R has been hovering in the oversold territory, suggesting a potential reversal in the near future.
Volatility Indicators:
- Bollinger Bands: The Bollinger Bands have been narrowing, indicating decreasing volatility in the stock price.
- Bollinger %B: The %B indicator has been fluctuating within a tight range, signaling a period of consolidation.
Volume Indicators:
- On-Balance Volume (OBV): The OBV has been declining, indicating selling pressure in the stock.
- Chaikin Money Flow (CMF): The CMF has been consistently negative, reflecting a lack of buying interest in the stock.
Key Observations:
- The stock is currently in a consolidation phase with limited price movement.
- The bearish sentiment is prevalent in the short term, as indicated by the MACD and EMA trends.
- The lack of strong momentum and volume support further reinforces the neutral outlook for the stock.
Conclusion:
Based on the analysis of the technical indicators, the stock is likely to continue trading sideways in the near term with a slight bias towards the downside. Investors should exercise caution and wait for clearer signals of a trend reversal before considering any significant positions. It is advisable to monitor the price action closely for any breakout or breakdown from the current consolidation range to determine the next potential direction of the stock price movement.