Technical Analysis of MRSK 2024-05-10
Overview:
In analyzing the technical indicators for MRSK stock over the last 5 days, we will delve into the trends, momentum, volatility, and volume indicators to provide a comprehensive outlook on the possible future stock price movement. By examining these key indicators, we aim to offer valuable insights and predictions for the upcoming trading days.
Trend Indicators:
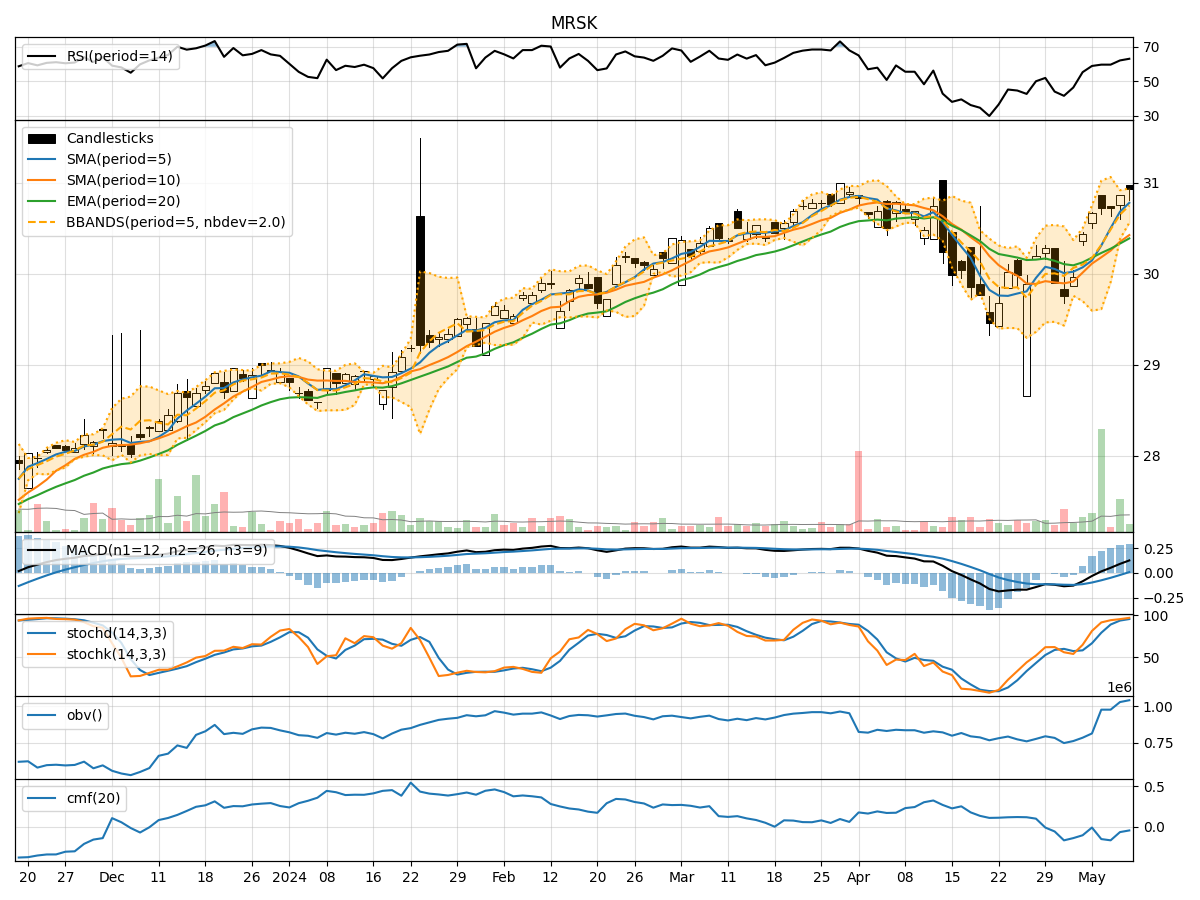
- Moving Averages (MA): The 5-day Moving Average has been consistently above the Simple Moving Average (SMA) and Exponential Moving Average (EMA), indicating a bullish trend.
- MACD: The MACD line has been consistently above the signal line, with both lines showing an upward trend, suggesting bullish momentum.
- MACD Histogram: The MACD Histogram has been increasing over the past 5 days, indicating strengthening bullish momentum.
Momentum Indicators:
- RSI: The Relative Strength Index (RSI) has been gradually increasing and is currently in the overbought territory, suggesting a bullish momentum.
- Stochastic Oscillator: Both %K and %D lines of the Stochastic Oscillator are in the overbought zone, indicating a strong bullish momentum.
- Williams %R: The Williams %R is in the oversold region, suggesting a potential reversal in the bullish momentum.
Volatility Indicators:
- Bollinger Bands: The stock price has been trading within the upper Bollinger Band, indicating an overbought condition and potential for a pullback.
- Bollinger %B: The Bollinger %B is above 0.8, signifying an overbought condition and a possible reversal in price.
- Average True Range (ATR): The ATR has been relatively stable, indicating consistent volatility in the stock price.
Volume Indicators:
- On-Balance Volume (OBV): The OBV has shown mixed signals over the past 5 days, suggesting indecision among market participants.
- Chaikin Money Flow (CMF): The CMF has been negative, indicating selling pressure in the stock.
Conclusion:
Based on the analysis of the technical indicators, the stock of MRSK is currently exhibiting strong bullish momentum across trend and momentum indicators. However, the overbought conditions highlighted by the Stochastic Oscillator and Bollinger Bands suggest a potential pullback or consolidation in the near term. The mixed signals from volume indicators also indicate a lack of clear direction in market sentiment.
Key Conclusion:
Given the current technical indicators, the stock of MRSK is likely to experience a short-term pullback or consolidation before potentially resuming its bullish trend. Traders should exercise caution and consider taking profits or implementing risk management strategies in anticipation of a temporary price correction.