Technical Analysis of MSFX 2024-05-10
Overview:
In analyzing the technical indicators for MSFX over the last 5 days, we will delve into the trend, momentum, volatility, and volume indicators to provide a comprehensive outlook on the possible stock price movement. By examining these key aspects, we aim to offer valuable insights and predictions for the upcoming days.
Trend Analysis:
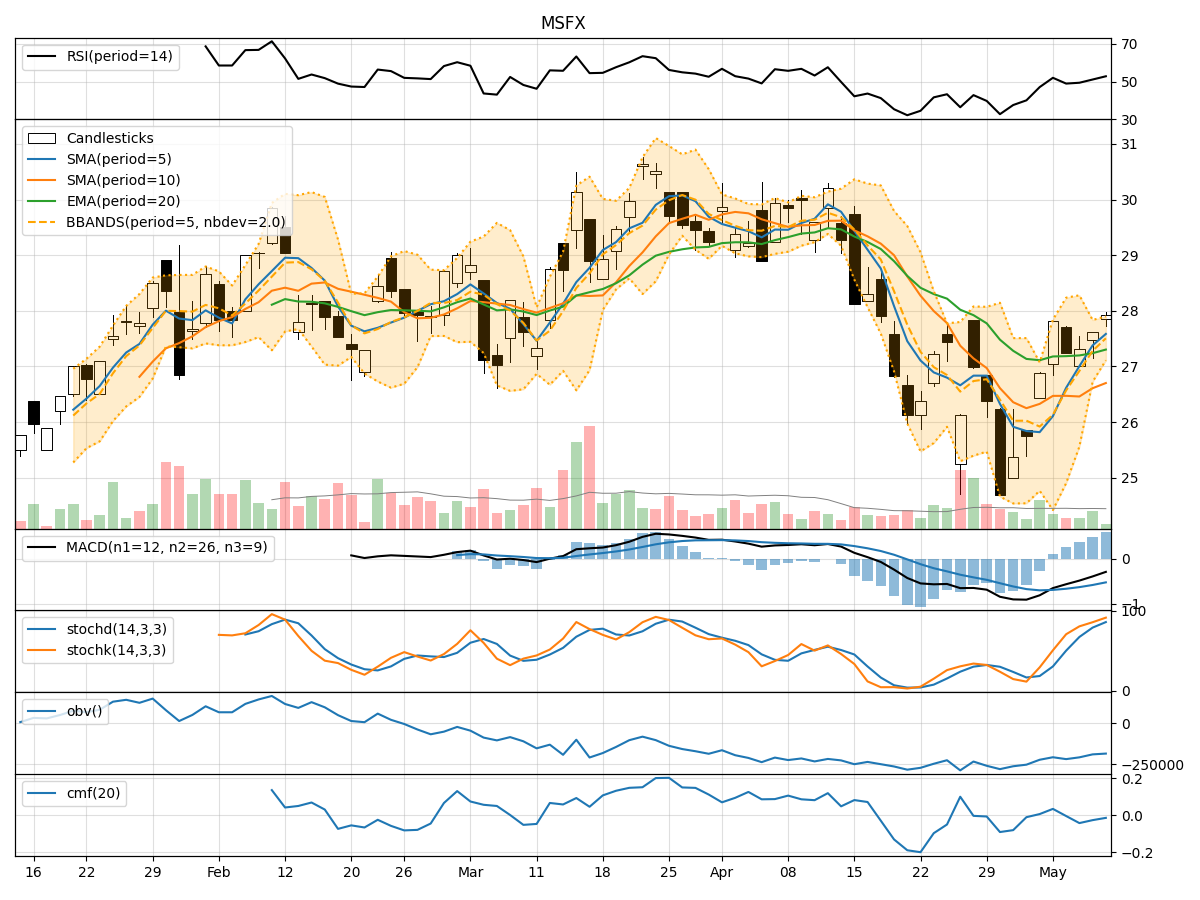
- Moving Averages (MA): The 5-day Moving Average (MA) has been consistently above the Simple Moving Average (SMA) and Exponential Moving Average (EMA), indicating a bullish trend.
- MACD: The Moving Average Convergence Divergence (MACD) has shown a positive trend with the MACD line consistently above the Signal line, suggesting bullish momentum.
Momentum Analysis:
- RSI: The Relative Strength Index (RSI) has been hovering around the neutral zone, indicating a balanced momentum.
- Stochastic Oscillator: Both %K and %D have been in the overbought territory, suggesting a potential reversal or consolidation.
Volatility Analysis:
- Bollinger Bands (BB): The Bollinger Bands have been narrowing, indicating decreasing volatility and a possible upcoming breakout.
Volume Analysis:
- On-Balance Volume (OBV): The OBV has shown a slight decrease, suggesting some selling pressure in the market.
- Chaikin Money Flow (CMF): The CMF has been negative, indicating a bearish money flow trend.
Key Observations:
- The trend indicators suggest a bullish sentiment in the short term.
- Momentum indicators show a mixed signal with potential for a reversal.
- Volatility is decreasing, hinting at a possible period of consolidation.
- Volume indicators point towards a slight increase in selling pressure.
Conclusion:
Based on the analysis of the technical indicators, the next few days for MSFX are likely to see sideways movement with a potential for a slight downward correction. Traders should exercise caution and closely monitor key support and resistance levels for potential entry or exit points. It is advisable to wait for further confirmation from the indicators before making significant trading decisions.