Technical Analysis of MSSS 2024-05-10
Overview:
In analyzing the technical indicators for MSSS over the last 5 days, we will delve into the trend, momentum, volatility, and volume indicators to provide a comprehensive outlook on the possible stock price movement in the coming days. By examining these key indicators, we aim to offer valuable insights and predictions to guide investment decisions.
Trend Analysis:
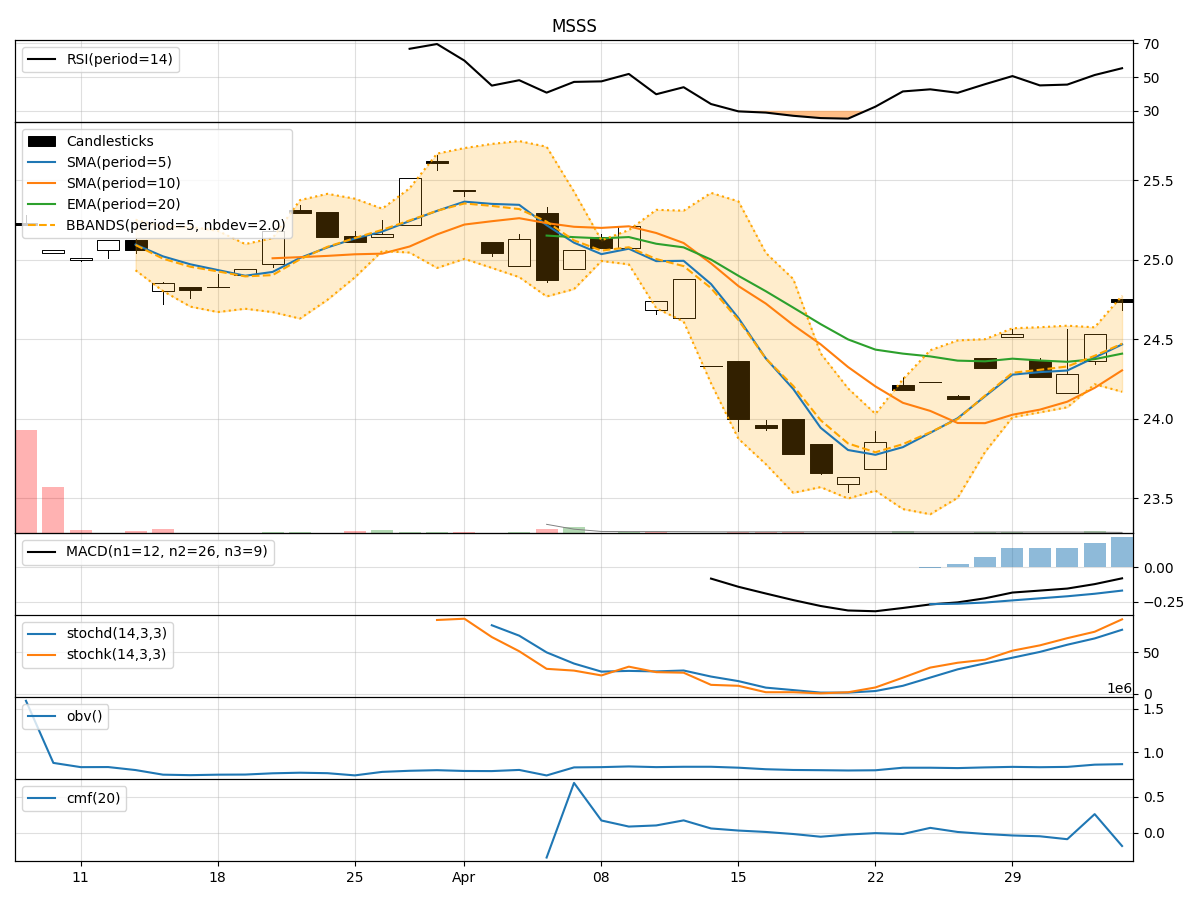
- Moving Averages (MA): The 5-day Moving Average (MA) has been consistently above the Simple Moving Average (SMA) and Exponential Moving Average (EMA), indicating a bullish trend.
- MACD: The MACD line has been consistently above the signal line, suggesting bullish momentum.
- MACD Histogram: The MACD Histogram has been consistently positive, further supporting the bullish trend.
Momentum Analysis:
- RSI: The Relative Strength Index (RSI) has been fluctuating around the 60-70 range, indicating moderate bullish momentum.
- Stochastic Oscillator: Both %K and %D have been in the overbought zone, suggesting a potential reversal or consolidation.
- Williams %R: The Williams %R has been hovering around oversold levels, indicating a potential buying opportunity.
Volatility Analysis:
- Bollinger Bands: The stock price has been trading within the Bollinger Bands, with the bands narrowing, indicating decreasing volatility.
- Bollinger %B: The %B indicator has been fluctuating around the middle range, suggesting a balanced market sentiment.
Volume Analysis:
- On-Balance Volume (OBV): The OBV has been relatively stable, indicating a neutral volume flow.
- Chaikin Money Flow (CMF): The CMF has been negative, suggesting a bearish money flow trend.
Conclusion:
Based on the analysis of the technical indicators, the stock of MSSS is likely to experience sideways consolidation in the coming days. The bullish trend indicated by moving averages and MACD may face resistance due to overbought conditions in the Stochastic Oscillator. The decreasing volatility and neutral volume flow further support the view of a sideways movement. Traders should exercise caution and wait for clearer signals before making significant trading decisions.
Key Recommendations:
- Monitor Stochastic Oscillator: Watch for potential reversal signals as the Stochastic Oscillator indicates overbought conditions.
- Wait for Confirmation: Look for confirmation from other indicators before entering new positions.
- Set Clear Stop-Loss Levels: Define clear stop-loss levels to manage risk in case of unexpected price movements.
By considering these key indicators and recommendations, investors can navigate the market dynamics surrounding MSSS effectively and make informed decisions aligned with their risk tolerance and investment goals.