Technical Analysis of MSTB 2024-05-10
Overview:
In analyzing the technical indicators for MSTB over the last 5 days, we will delve into the trend, momentum, volatility, and volume indicators to provide a comprehensive outlook on the possible stock price movement in the coming days. By examining these key indicators, we aim to offer valuable insights and predictions for potential investors.
Trend Analysis:
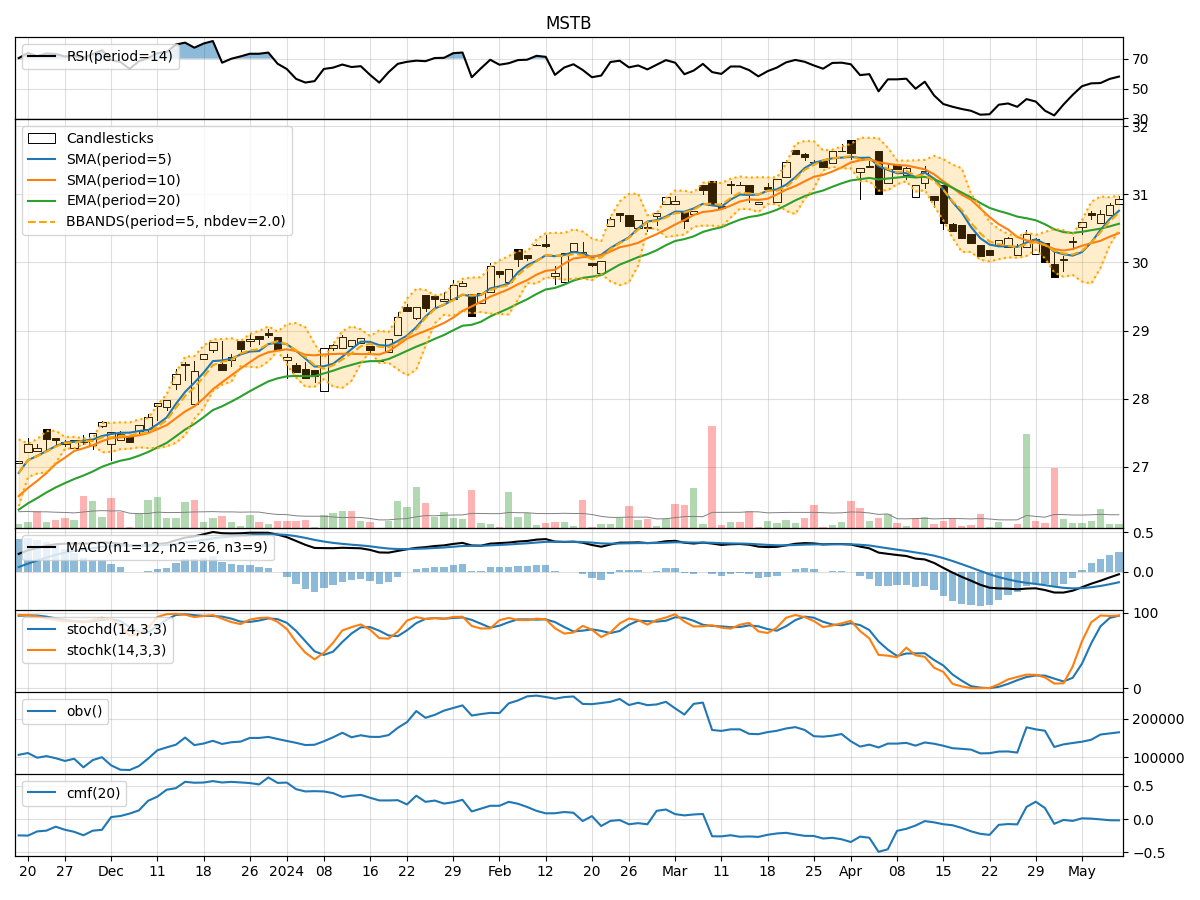
- Moving Averages (MA): The 5-day Moving Average (MA) has been consistently above the Simple Moving Average (SMA) and Exponential Moving Average (EMA), indicating a short-term uptrend.
- MACD: The MACD line has been negative but trending upwards, while the MACD Histogram has been consistently positive, suggesting a potential bullish momentum.
- Conclusion: The trend indicators point towards a bullish sentiment in the short term.
Momentum Analysis:
- RSI: The Relative Strength Index (RSI) has been gradually increasing and is currently in the neutral zone, indicating a balanced momentum.
- Stochastic Oscillator: Both %K and %D have been in the overbought territory, suggesting a potential reversal or consolidation.
- Conclusion: The momentum indicators signal a neutral to slightly bearish outlook.
Volatility Analysis:
- Bollinger Bands (BB): The stock price has been trading within the Bollinger Bands, with the bands narrowing, indicating decreasing volatility.
- Conclusion: Volatility is decreasing, suggesting a consolidation phase in the stock price.
Volume Analysis:
- On-Balance Volume (OBV): The OBV has been declining, indicating a decrease in buying pressure.
- Chaikin Money Flow (CMF): The CMF has been negative, reflecting a lack of buying interest.
- Conclusion: Volume indicators point towards a bearish sentiment in terms of buying pressure.
Overall Conclusion:
Based on the analysis of trend, momentum, volatility, and volume indicators, the next few days for MSTB are likely to see a consolidation phase with a neutral to slightly bearish bias. The trend indicators suggest a short-term bullish sentiment, while momentum indicators indicate a neutral to slightly bearish momentum. Volatility is decreasing, signaling a consolidation phase, and volume indicators point towards a bearish sentiment in terms of buying pressure.
Recommendation:
Considering the overall analysis, it is advisable to exercise caution in trading MSTB in the coming days. Investors may consider waiting for clearer signals or confirmation of a trend reversal before making significant trading decisions. Monitoring key support and resistance levels along with potential catalysts in the market can provide additional insights for strategic decision-making.