Technical Analysis of MSTI 2024-05-10
Overview:
In analyzing the technical indicators for MSTI over the last 5 days, we will delve into the trend, momentum, volatility, and volume indicators to provide a comprehensive outlook on the possible stock price movement in the coming days. By examining these key aspects, we aim to offer valuable insights and predictions to guide your investment decisions.
Trend Indicators:
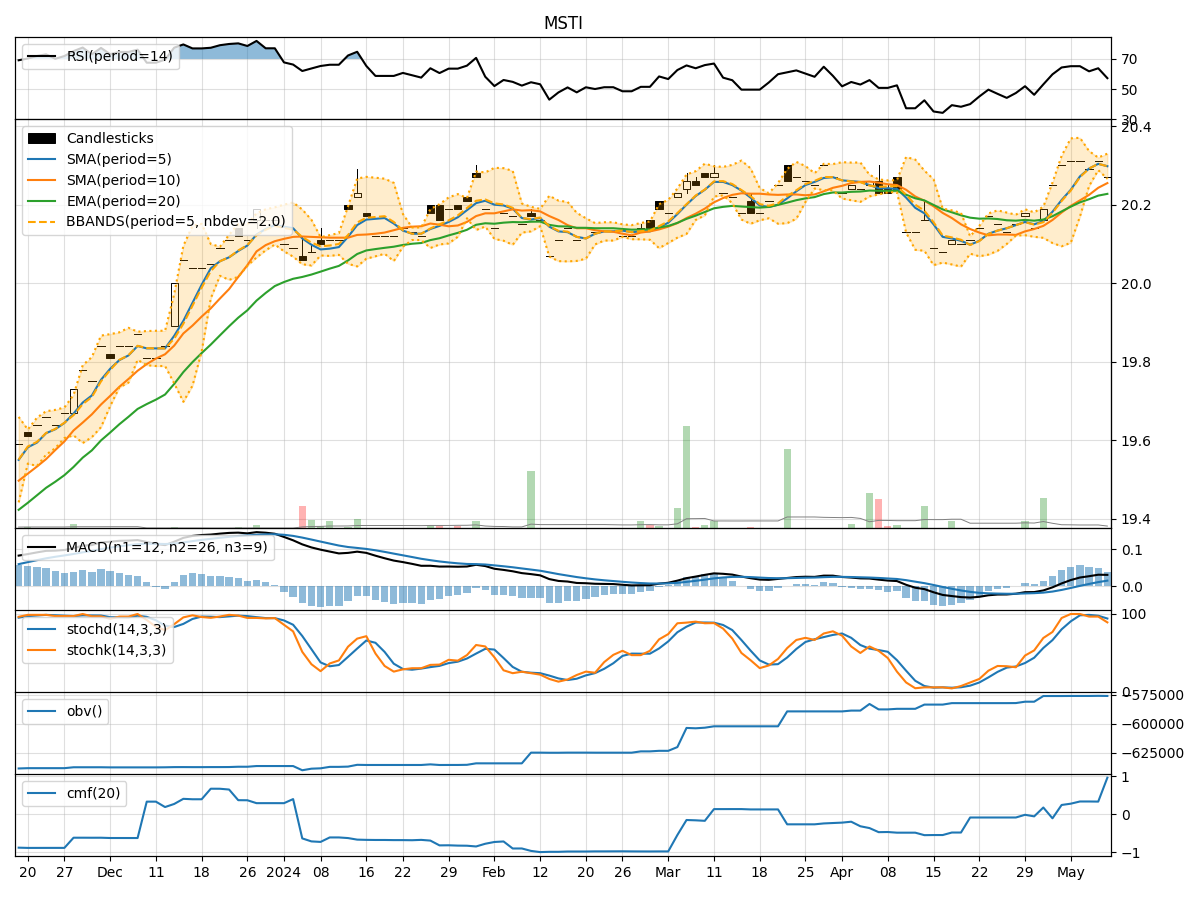
- Moving Averages (MA): The 5-day Moving Average (MA) has been relatively stable around the current price, indicating a neutral trend.
- MACD: The Moving Average Convergence Divergence (MACD) shows a positive value, suggesting a bullish momentum in the short term.
- MACD Histogram: The MACD Histogram is positive and increasing, indicating strengthening bullish momentum.
Momentum Indicators:
- RSI: The Relative Strength Index (RSI) is in the neutral zone, suggesting neither overbought nor oversold conditions.
- Stochastic Oscillator: Both %K and %D lines of the Stochastic Oscillator are in the overbought territory, signaling a potential reversal.
- Williams %R: The Williams %R is in the oversold region, indicating a possible buying opportunity.
Volatility Indicators:
- Bollinger Bands (BB): The Bollinger Bands are relatively narrow, indicating low volatility in the stock price.
- Bollinger %B: The %B indicator is close to 0.5, suggesting the stock is trading around the middle of the bands.
Volume Indicators:
- On-Balance Volume (OBV): The OBV has been relatively flat, indicating no significant divergence between volume and price movements.
- Chaikin Money Flow (CMF): The CMF is positive, indicating buying pressure in the stock.
Key Observations and Opinions:
- Trend: The trend indicators suggest a neutral to slightly bullish outlook in the short term.
- Momentum: Mixed signals are observed with overbought conditions in the Stochastic Oscillator and oversold conditions in the Williams %R.
- Volatility: Low volatility is currently present, indicating a period of consolidation or sideways movement.
- Volume: The volume indicators show no significant divergence, reflecting stability in volume and price movements.
Conclusion:
Based on the analysis of the technical indicators, the next few days for MSTI could see sideways movement with a slight bullish bias. Traders may consider staying cautious due to mixed signals in momentum indicators and low volatility levels. It is advisable to monitor key support and resistance levels closely for potential breakout opportunities.