Technical Analysis of MSTQ 2024-05-10
Overview:
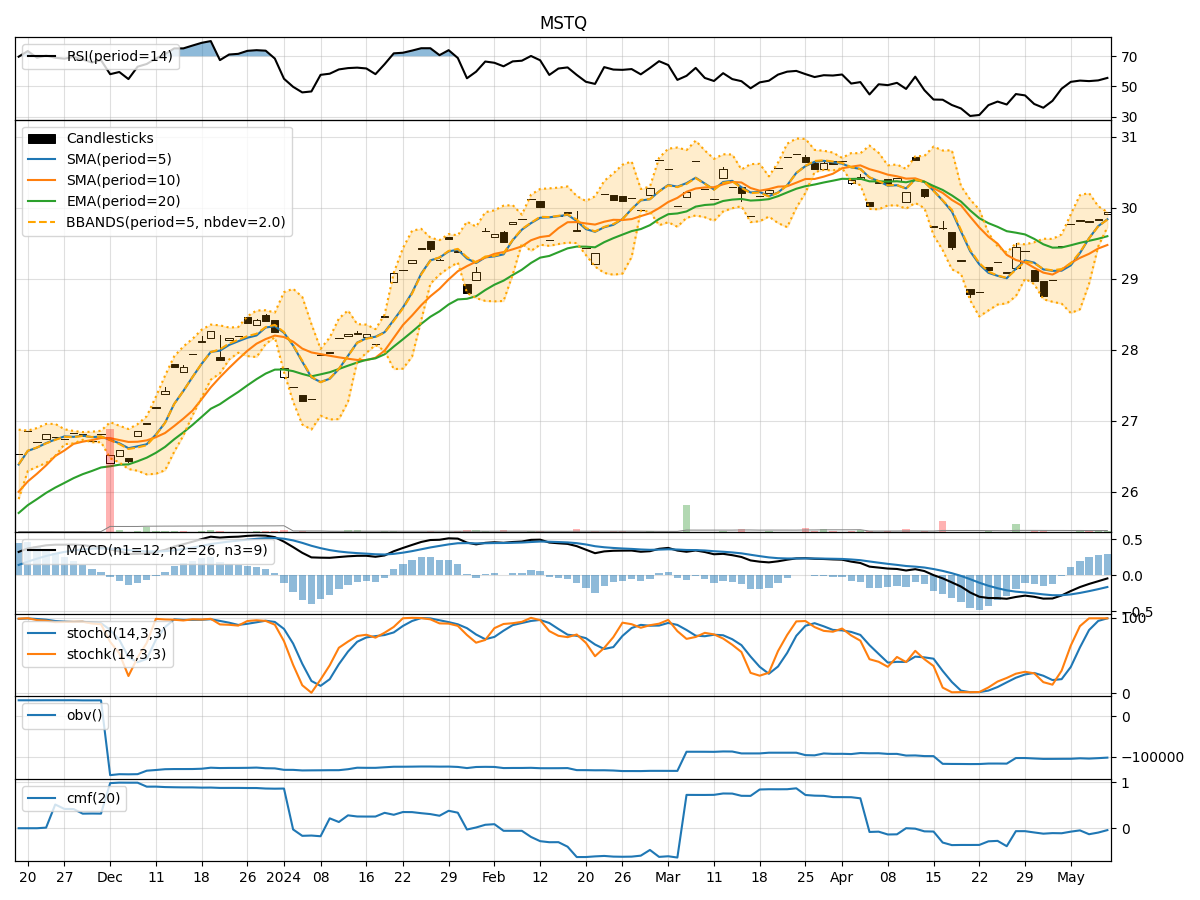
In analyzing the technical indicators for MSTQ over the last 5 days, we will delve into the trend, momentum, volatility, and volume indicators to provide a comprehensive outlook on the possible stock price movement in the coming days. By examining these key indicators, we aim to offer valuable insights and predictions for informed decision-making.
Trend Analysis:
- Moving Averages (MA): The 5-day MA has been consistently above the closing prices, indicating a short-term uptrend.
- MACD: The MACD line has been negative but trending upwards, suggesting a potential reversal in the bearish momentum.
- RSI: The RSI has been fluctuating around the neutral zone, reflecting indecision in the market sentiment.
Momentum Analysis:
- Stochastic Oscillator: Both %K and %D have been in the overbought zone, signaling a potential reversal or consolidation.
- Williams %R: The indicator has been hovering around the oversold territory, indicating a possible buying opportunity.
Volatility Analysis:
- Bollinger Bands (BB): The bands have been narrowing, indicating decreasing volatility and a potential breakout in the near future.
Volume Analysis:
- On-Balance Volume (OBV): The OBV has shown mixed signals, reflecting uncertainty in the accumulation/distribution of the stock.
- Chaikin Money Flow (CMF): The CMF has been negative, suggesting a lack of buying pressure in the market.
Key Observations:
- The stock is currently in a consolidation phase, with mixed signals from various indicators.
- The narrowing Bollinger Bands indicate a potential breakout, but the direction is uncertain.
- The Stochastic Oscillator and Williams %R suggest a possible reversal or consolidation in the short term.
Conclusion:
Based on the analysis of the technical indicators, the next few days' stock price movement for MSTQ is likely to be sideways with a slight upward bias. Traders should exercise caution and wait for a clearer trend to emerge before making significant trading decisions. It is advisable to monitor key levels and wait for confirmation from multiple indicators before taking any positions.