Technical Analysis of MSTY 2024-05-10
Overview:
In analyzing the technical indicators for MSTY over the last 5 days, we will delve into the trend, momentum, volatility, and volume indicators to provide a comprehensive outlook on the possible stock price movement in the coming days. By examining these key indicators, we aim to offer valuable insights and predictions for potential investors.
Trend Analysis:
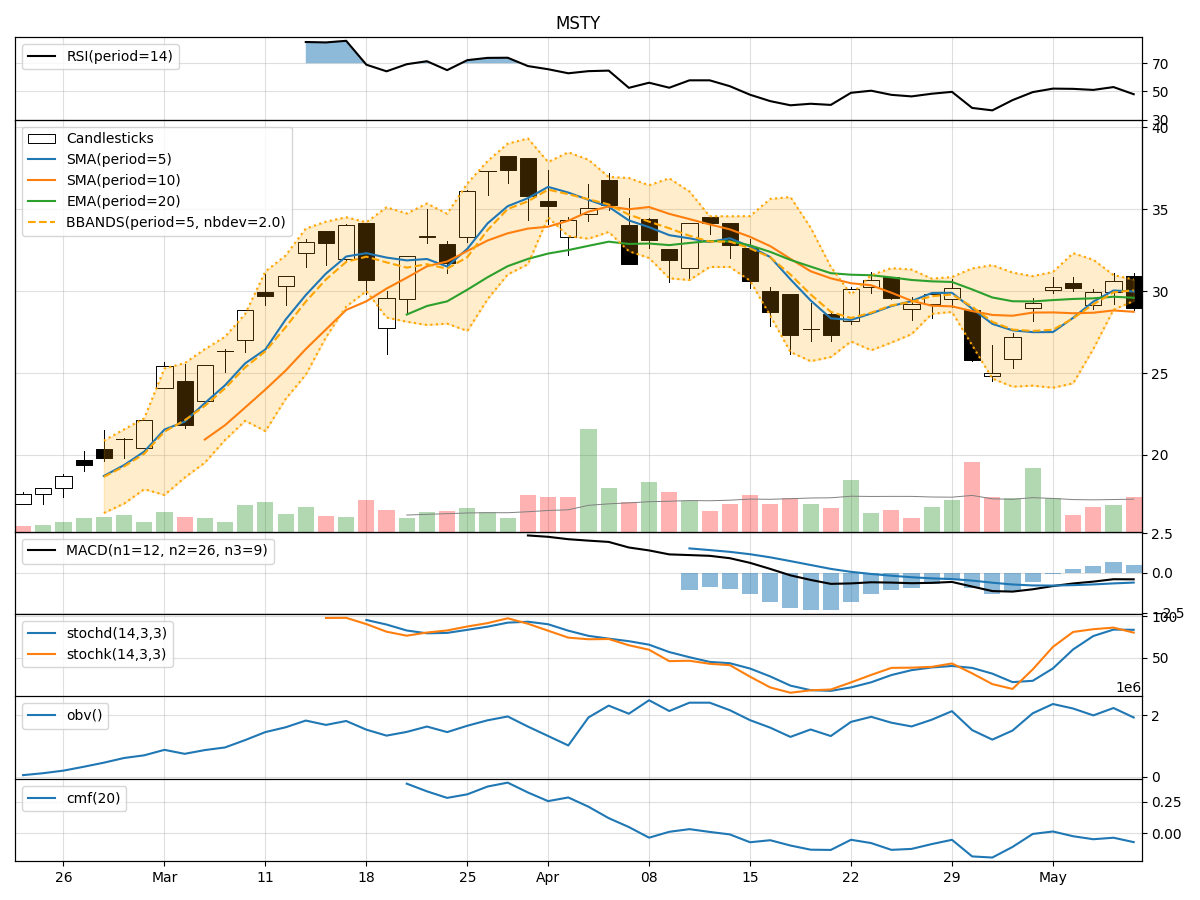
- Moving Averages (MA): The 5-day Moving Average (MA) has been fluctuating around the Simple Moving Average (SMA) and Exponential Moving Average (EMA) values, indicating a lack of clear trend direction.
- MACD: The Moving Average Convergence Divergence (MACD) has been hovering around the zero line, suggesting a neutral stance in terms of momentum.
Key Observation: The trend indicators do not show a strong directional bias, signaling a period of consolidation or sideways movement.
Momentum Analysis:
- RSI: The Relative Strength Index (RSI) has been oscillating around the 50 level, indicating a balanced momentum between buying and selling pressure.
- Stochastic Oscillator: Both %K and %D values have been relatively high, suggesting a potential overbought condition in the short term.
Key Observation: Momentum indicators reflect a mixed sentiment with a slight inclination towards overbought levels.
Volatility Analysis:
- Bollinger Bands (BB): The Bollinger Bands have shown widening and narrowing patterns, indicating fluctuations in price volatility.
- Bollinger Band %B: The %B value has been oscillating near the midline, reflecting a neutral stance in terms of volatility.
Key Observation: Volatility indicators suggest a period of fluctuating volatility without a clear trend in either direction.
Volume Analysis:
- On-Balance Volume (OBV): The OBV has shown a declining trend over the last few days, indicating a potential decrease in buying pressure.
- Chaikin Money Flow (CMF): The CMF has been negative, signaling a bearish money flow trend.
Key Observation: Volume indicators point towards a weakening buying pressure and bearish money flow sentiment.
Conclusion:
Based on the analysis of trend, momentum, volatility, and volume indicators, the overall outlook for MSTY in the next few days leans towards a sideways consolidation pattern with a slight bearish bias. The lack of clear trend direction, mixed momentum signals, fluctuating volatility, and weakening buying pressure suggest a period of indecision and potential downside risk.
Recommendation: It is advisable for investors to exercise caution and closely monitor the price action for any potential breakdown below key support levels. Consider implementing risk management strategies to protect against downside risks in the current market environment.