Technical Analysis of MSVX 2024-05-10
Overview:
In analyzing the technical indicators for MSVX over the last 5 days, we will delve into the trend, momentum, volatility, and volume indicators to provide a comprehensive outlook on the possible stock price movement in the coming days. By examining these key aspects, we aim to offer valuable insights and predictions for potential investors.
Trend Analysis:
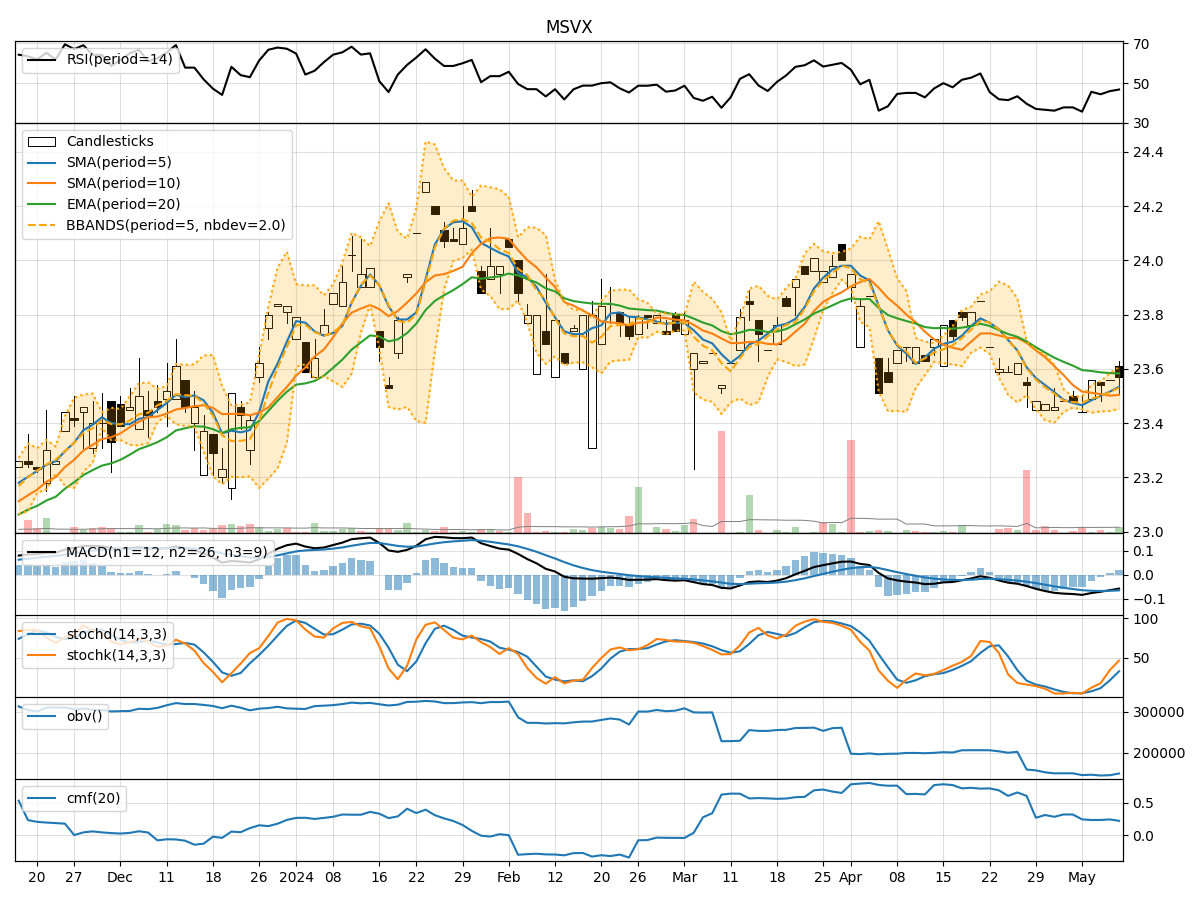
- Moving Averages (MA): The 5-day MA has been relatively stable around the closing prices, indicating a short-term trend. The SMA(10) and EMA(20) have shown a slight downward trend, suggesting a potential bearish sentiment.
- MACD and Signal Line: The MACD has been consistently negative, with the MACD line below the signal line, indicating a bearish trend in the short term.
Momentum Analysis:
- RSI: The RSI values have been fluctuating around the mid-range, indicating a lack of strong momentum in either direction.
- Stochastic Oscillator: Both %K and %D values have been increasing, suggesting a potential bullish momentum building up.
- Williams %R: The Williams %R values have been improving but still in the oversold territory, indicating a possible reversal in the short term.
Volatility Analysis:
- Bollinger Bands: The stock price has been trading within the Bollinger Bands, with the bands narrowing slightly, indicating reduced volatility.
- Bollinger %B: The %B values have been fluctuating around the mid-range, suggesting a neutral sentiment in terms of volatility.
Volume Analysis:
- On-Balance Volume (OBV): The OBV values have been fluctuating, indicating a balance between buying and selling pressure.
- Chaikin Money Flow (CMF): The CMF(20) values have been positive, indicating a potential inflow of money into the stock.
Key Observations and Opinions:
- Trend: The trend indicators suggest a bearish sentiment in the short term.
- Momentum: The momentum indicators show mixed signals, with a potential bullish momentum building up.
- Volatility: Volatility has been relatively low, indicating a stable price movement.
- Volume: The volume indicators suggest a balanced buying and selling pressure.
Conclusion:
Based on the analysis of the technical indicators, the next few days' possible stock price movement for MSVX is likely to be sideways with a slight upward bias. While the trend indicators point towards a bearish sentiment, the momentum indicators indicate a potential bullish momentum building up. The low volatility and balanced volume further support a sideways movement with a slight upward bias. Investors should closely monitor the price action and key support/resistance levels for potential trading opportunities.