Technical Analysis of MTBA 2024-05-10
Overview:
In analyzing the technical indicators for MTBA over the last 5 days, we will delve into the trend, momentum, volatility, and volume indicators to provide a comprehensive assessment of the stock's potential price movement. By examining these key factors, we aim to offer valuable insights and predictions for the next few days.
Trend Analysis:
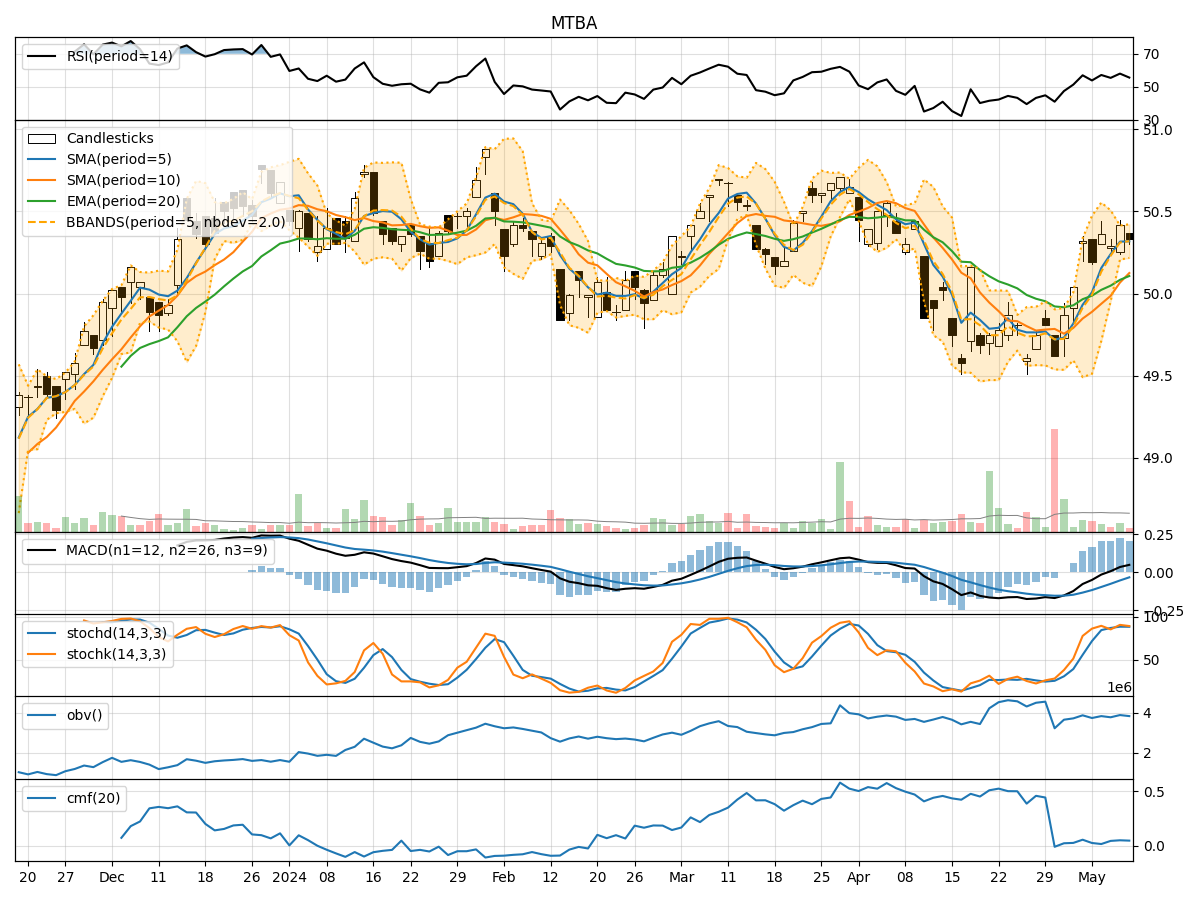
- Moving Averages (MA): The 5-day MA has been consistently above the closing prices, indicating a bullish trend.
- Exponential Moving Average (EMA): The EMA has been trending upwards, supporting the bullish sentiment.
- Moving Average Convergence Divergence (MACD): The MACD and signal line have been positive, suggesting bullish momentum.
- Conclusion: The trend indicators point towards an upward trend in the stock price.
Momentum Analysis:
- Relative Strength Index (RSI): RSI values have been in the overbought territory, indicating strong buying momentum.
- Stochastic Oscillator: Both %K and %D have been in the overbought zone, signaling potential for a pullback.
- Williams %R: The indicator has been hovering in the oversold region, suggesting a possible reversal.
- Conclusion: Momentum indicators suggest a potential pullback or consolidation in the stock price.
Volatility Analysis:
- Bollinger Bands: The stock price has been trading within the bands, indicating stable volatility.
- Bollinger Band Width: The bands have been relatively narrow, suggesting a period of low volatility.
- Conclusion: Volatility indicators imply a period of consolidation or sideways movement in the stock price.
Volume Analysis:
- On-Balance Volume (OBV): The OBV has shown a positive trend, indicating accumulation by investors.
- Chaikin Money Flow (CMF): The CMF has been positive, reflecting buying pressure in the stock.
- Conclusion: Volume indicators support further upside potential in the stock price.
Overall Conclusion:
Based on the analysis of trend, momentum, volatility, and volume indicators, the next few days for MTBA are likely to see a continuation of the upward trend with potential for a pullback or consolidation in momentum. The stock is expected to trade within a range with a bullish bias supported by strong volume accumulation. Traders may consider buying on dips or holding existing positions with a target towards higher price levels. It is essential to monitor key support and resistance levels for timely decision-making.